Executive Summary
When short-term interest rates are higher than long-term interest rates, the curve is considered inverted. Typically, this occurs just prior to or during recessions. In the first graph below, one can see the curve has not been this inverted in 40 years. Additionally, leading economic indicators seem to be pointing toward recession. The third graph shows that manufacturing is at recessionary levels, and the fourth graph shows the services sector indicating no growth. The inverted yield curve and leading economic indicators look recessionary; however, time will tell.
Please continue to The Details for more of my analysis.
“I’ve always been asked, ‘What is my favorite car?’ and I’ve always said, ‘The next one.’”
–Carroll Shelby
The Details
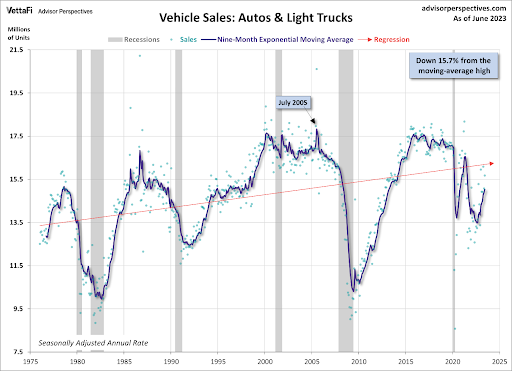
Looking at the nine-month moving average, the post-financial crisis peak in vehicle sales occurred in 2015 at a little over 17.5 million units. As the pandemic began and the economy shut down, sales plummeted. Then, a combination of new stimulus funds and low interest rates incited a surge in vehicle purchases. This reversed with a global microchip shortage resulting in low vehicle inventories and spiking inflation. The moving average has since risen; however, the level remains below that at the start of the last three recessions.

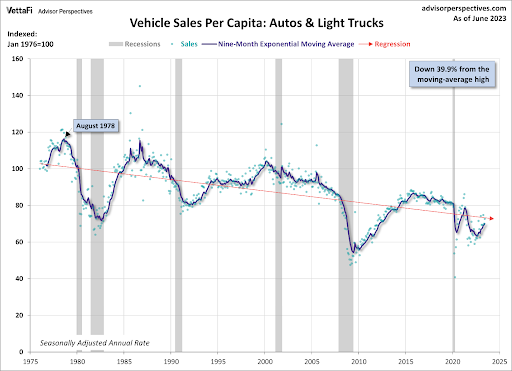
From a long-term trend perspective, vehicle sales on a per capita basis have been in a downward trend since the mid-1970’s, as shown below.

When inventories became scarce and sales were boosted by stimulus funds, the average price of a new car grew exponentially. Currently, according to data from Kelley Blue Book, the average price of a new car is about $48,000.
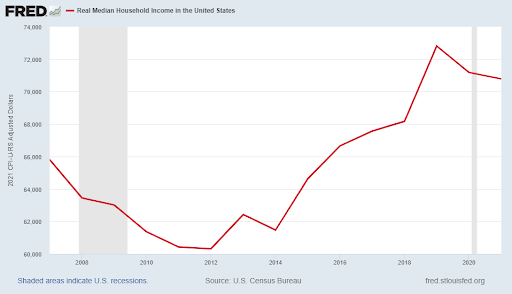
Real median household income in the U.S. is about $70,800. That means the average price of a new car represents 68% of median household income. If a household with income of $70,800 bought two new cars, the average price of the two cars would equal 136% of their income.

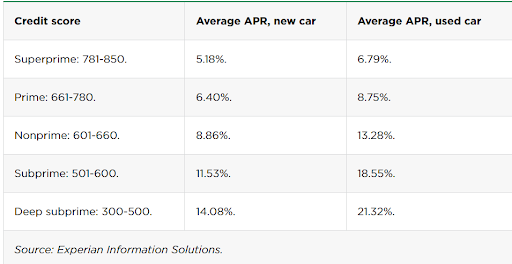
Inflation’s impact can be seen in the price of new cars. However, the full impact of rising interest rates will not be felt for a while. Today’s higher rates will force some families to put off purchasing a new vehicle. According to the chart from Experian below, interest rates vary significantly based upon one’s credit score. The range for new cars is 5.18%-14.08% and for used cars is 6.79%-21.32%. These higher rates are forcing buyers to extend the term of their car notes leaving them more susceptible to being underwater on their car loan.

As people decide to delay their car purchases due to high prices and rising interest rates, manufacturers are beginning to offer incentives. During May average transaction prices fell below MSRP for just the third time in two years. Incentives increased to an average of $1,914 per car, the highest in a year according to Kelley Blue Book.
Historically, dealerships on average stocked about 60 days’ sales worth of cars. This increased to a 95-day supply in May 2019, then fell dramatically. Current inventory sits at about 55-days’ sales or 46% higher than at the same time last year. The impact of inflation and higher interest rates is causing demand for new cars to slow.
Inflation is eating into household budgets. The added cost of higher interest rates and sky-high new car prices will force families to delay car purchases. To offset this, manufacturers will likely continue increasing incentives. Eventually, the effective price of a new car should drop. But unfortunately, no one knows exactly when that will occur. Time will tell.
The S&P 500 Index closed at 4,399, down 1.1% for the week. The yield on the 10-year Treasury
Note rose to 4.05%. Oil prices increased to $74 per barrel, and the national average price of gasoline according to AAA remained at $3.54 per gallon.
© 2023. This material was prepared by Bob Cremerius, CPA/PFS, of Prudent Financial, and does not necessarily represent the views of other presenting parties, nor their affiliates. This information should not be construed as investment, tax or legal advice. Past performance is not indicative of future performance. An index is unmanaged and one cannot invest directly in an index. Actual results, performance or achievements may differ materially from those expressed or implied. All information is believed to be from reliable sources; however we make no representation as to its completeness or accuracy.
Securities offered through First Heartland Capital, Inc., Member FINRA & SIPC. | Advisory Services offered through First Heartland Consultants, Inc. Prudent Financial is not affiliated with First Heartland Capital, Inc.

