Executive Summary
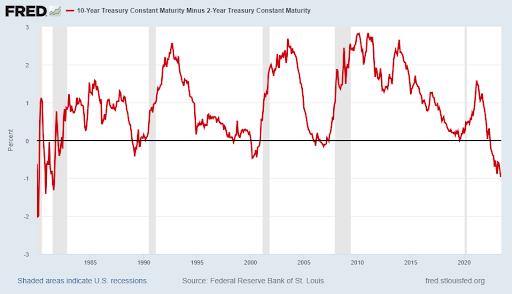
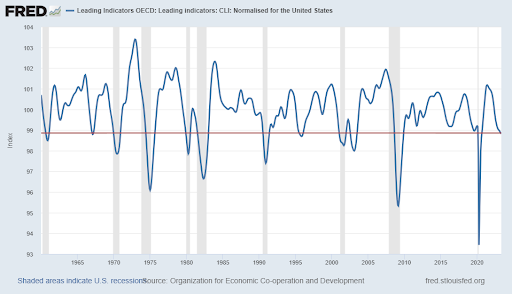
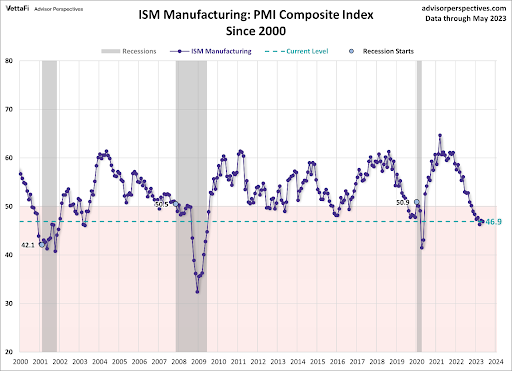
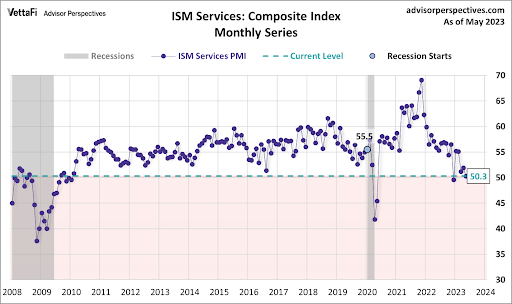
When short-term interest rates are higher than long-term interest rates, the curve is considered inverted. Typically, this occurs just prior to or during recessions. In the first graph below, one can see the curve has not been this inverted in 40 years. Additionally, leading economic indicators seem to be pointing toward recession. The third graph shows that manufacturing is at recessionary levels, and the fourth graph shows the services sector indicating no growth. The inverted yield curve and leading economic indicators look recessionary; however, time will tell.
Please continue to The Details for more of my analysis.
“Whenever I think of the past, it brings back so many memories.”
–Steven Wright
The Details
Normally, long-term interest rates are higher than short-term rates. This is due to the fact that long-term bonds are subject to the risk that interest rates will rise, and the value of the bonds will fall. Also, for non-Treasury long-term bonds, there is a longer period subject to the risk of default; therefore, a higher interest rate is commanded to mitigate this risk. On a graph where interest rates are plotted on the vertical, or y-axis, from lower rates to higher rates; and time is plotted on the horizontal, or x-axis, the line normally would slope upward. In the rare occurrences when short-term rates are higher than long-term rates, the curve is considered “inverted” or downward sloping.
An inverted yield curve typically occurs just prior to or during a recession. Currently, as shown in the graph below, the yield curve – utilizing 2-year and 10-year Treasury securities – is more inverted than any time in the prior 40 years. Currently the yield curve is at -0.97%. The reason for the inversion is a combination of the Fed indicating they will likely raise short-term interest rates at least two more times this year, and a weakening economy. The Fed remains concerned about inflation and believes short-term rates need to go higher to bring inflation to their target of 2%. As the economy weakens, long-term rates tend to fall. Taken together, this results in an inverted yield curve.

I will show a few graphs that indicate the economy is either in or near a recession. First is the OECD Leading Indicators. The OECD is the Organization for Economic Co-operation and Development. Notice in the graph of their leading economic indicators, the current level has rarely been seen outside of a recession.

Below, I will show the Institute for Supply Management’s (ISM) Purchasing Managers’ Index (PMI) for the manufacturing sector and the larger services sector. Since 2000, the manufacturing PMI has only been this low just prior to or during a recession.

The services PMI received a significant boost after the pandemic due to massive stimulus payments. However, since then the PMI has dropped to 50.3, a level typically associated with a recession. A reading above 50 indicates growth and below 50 represents a contraction in activity. At 50.3 the reading is effectively flat, yet down substantially from its 2021 high.

The yield curve is significantly inverted due to the Fed’s intent to keep raising short-term interest rates and the current weak economy. The timing of recessions is only known in hindsight. We should discover soon whether a recession is underway.
The S&P 500 Index closed at 4,348, down 1.4% for the week. The yield on the 10-year Treasury
Note fell to 3.74%. Oil prices decreased to $69 per barrel, and the national average price of gasoline according to AAA dropped to $3.57 per gallon.
© 2023. This material was prepared by Bob Cremerius, CPA/PFS, of Prudent Financial, and does not necessarily represent the views of other presenting parties, nor their affiliates. This information should not be construed as investment, tax or legal advice. Past performance is not indicative of future performance. An index is unmanaged and one cannot invest directly in an index. Actual results, performance or achievements may differ materially from those expressed or implied. All information is believed to be from reliable sources; however we make no representation as to its completeness or accuracy.
Securities offered through First Heartland Capital, Inc., Member FINRA & SIPC. | Advisory Services offered through First Heartland Consultants, Inc. Prudent Financial is not affiliated with First Heartland Capital, Inc.

