Executive Summary
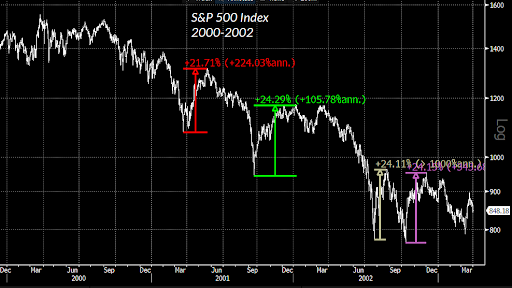
Over the past decade, the Fed’s monetary policy was seen as the most important determinant for the direction of the stock market. The Fed has maintained tightening policies for over a year, reducing the size of their balance sheet and raising interest rates. A couple of brief interruptions recently provided a temporary surge in liquidity. This, along with “hope” that the Fed will pause their rate hikes, possibly even lowering rates, has given speculators an excuse to jump back into the stock market. The current bear market rally sits on the low-end of rallies seen during the Great Depression and bursting of the Tech Bubble, as shown in the graphs below. Speculators today are more concerned about missing out on an extension of the stock market bubble than they are about the Fed’s continued monetary tightening and the weakening economy. Maybe investors should step back for the reasons explained below.
Please continue to The Details for more of my analysis.
“Survey and test a prospective action before undertaking it. Before you proceed, step back and look at the big picture, lest you act rashly on raw impulse.”
–Epictetus
The Details
For over a decade, investors determined the most important factors in determining the direction of the stock market were the change in the Federal Reserve Bank’s (Fed’s) balance sheet due to Quantitative Easing (QE) or Quantitative Tightening (QT), and the change in the Federal Funds Rate (FFR). While there were brief divergences during the decade, the overall movement of the stock market aligned to some degree with these items. Lately, investors have decided to ignore these factors and are now fighting the Fed. Additionally, investors are fighting the preponderance of economic evidence which indicates a recession is either underway or soon to begin.
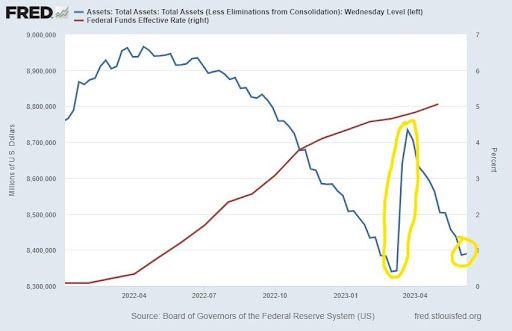
Last year the Fed began aggressively implementing QT and raising the FFR. These monetary tightening measures are largely responsible for the downturn in the stock market and the weakening of the economy. The rapid rise in interest rates impacted the market value of existing Treasury Securities, leading to significant liquidity problems for some banks. Therefore, in an attempt to save the struggling banks, the Fed, in March of this year, implemented the Bank Term Funding Program (BTFP) to inject liquidity into struggling banks through special loans. Notice in the graph below, the initial drop in Fed assets (blue line) and then a sudden surge in March 2023. This was the result of the Fed’s actions to save stressed banks. Since then, QT has almost completely eliminated the increase due to the BTFP. Also notice the sharp increase in the FFR (red line).
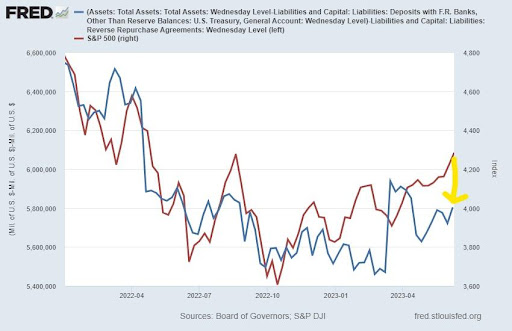
In addition to the BTFP, the political battle to secure an increase in the debt ceiling forced the Treasury Secretary to drain the Treasury General Account (TGA). The reduction in the TGA was viewed by many as another injection of liquidity, fueling the current bear market rally. The excitement in markets due to these two brief liquidity injections led speculators to go crazy purchasing a handful of stocks. This activity then pulled in other investors who succumbed to FOMO (Fear Of Missing Out). Notice in the graph below the widening gap between Fed liquidity in blue and the S&P 500 in red.
Nothing has fundamentally changed that would somehow justify the recent stock market surge. This bear market rally is merely being fed by speculators who cannot see the forest for the trees. Many speculators are hoping the Fed will soon reverse course and reduce interest rates. I believe this is wishful thinking at best. The Fed is meeting this week and will announce their decision on interest rates on Wednesday. In the meantime, QT continues and now that the debt ceiling has been raised, the Treasury will pull liquidity out of the market as they refill the TGA.
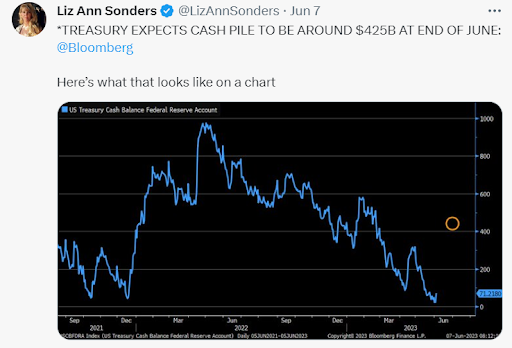
The drop in the TGA can be seen in the graph below from Liz Ann Sonders of Charles Schwab. However, as stated in her Tweet below, the Treasury expects to build back the TGA to around $425 billion by the end of June (see the orange circle in the graph). That is only about two weeks away. This, combined with QT, will provide a significant drain on liquidity. And if the Fed decides to raise the FFR this week, the markets will be hit with a substantial monetary punch.
Many technical investors like to use targeted rules of thumb to indicate stock market milestones. For instance, some believe if the S&P 500 has risen 20% from its lows, then a new bull market has begun. From a full market cycle perspective, this is somewhat ludicrous. Bear market cycles have always incurred strong temporary reversals or bear market rallies.
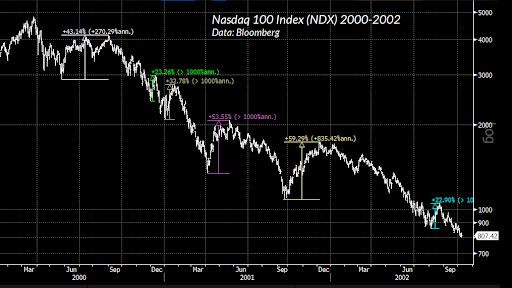
The three graphs below are from economist John Hussman. The first two graphs illustrate bear market rallies occurring during the bursting of the Tech Bubble (2000-2002) in the Nasdaq 100 and the S&P 500. Although difficult to read on these graphs, the Nasdaq 100 had six bear market rallies ranging from 22% to 59%. The S&P 500 had four rallies, all exceeding 20%, reaching as high as 24%!
The following graph from the Great Depression era shows five bear market rallies ranging from 23% to 48%.
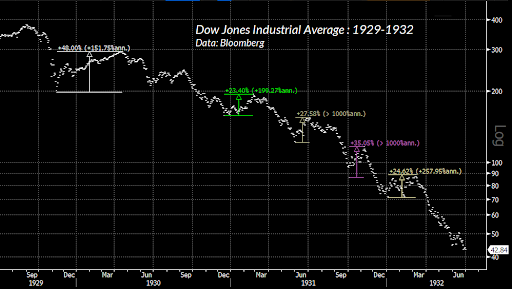
The current bear market rally from last October’s low has risen about 20%. This level of bear market rally is what would be considered on the lower end of the bear market rally ranges illustrated in the graphs above. Jumping in due to FOMO or “hopes” for a rate decrease could ultimately lead to devastation. The Shiller Price-to-Earnings Ratio is above 30, close to levels at the market peak prior to the Great Depression.
The same factors which fed the decade-long bull market in the stock market are now being ignored by speculators. The Fed is implementing QT, interest rates remain high and could go higher, and the Treasury is draining liquidity to fill the TGA. It might be time to step back and look again at the data.
The S&P 500 Index closed at 4,299, up 0.4% for the week. The yield on the 10-year Treasury
Note rose to 3.75%. Oil prices fell to $70 per barrel, and the national average price of gasoline according to AAA increased to $3.59 per gallon.
© 2023. This material was prepared by Bob Cremerius, CPA/PFS, of Prudent Financial, and does not necessarily represent the views of other presenting parties, nor their affiliates. This information should not be construed as investment, tax or legal advice. Past performance is not indicative of future performance. An index is unmanaged and one cannot invest directly in an index. Actual results, performance or achievements may differ materially from those expressed or implied. All information is believed to be from reliable sources; however we make no representation as to its completeness or accuracy.
Securities offered through First Heartland Capital, Inc., Member FINRA & SIPC. | Advisory Services offered through First Heartland Consultants, Inc. Prudent Financial is not affiliated with First Heartland Capital, Inc.

