Executive Summary
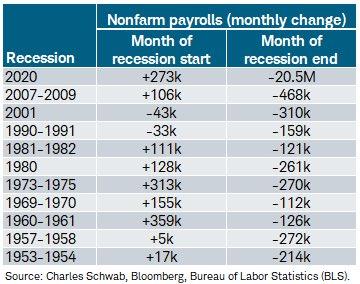
Last Friday the Bureau of Labor Statistics reported 339,000 new jobs were created in May, and the unemployment rate increased from 3.4% to 3.7%. The jobs number is derived from the Establishment Survey, while the unemployment number is from the Household Survey. Of note is the Household Survey “number of people employed” decreased by 310,000 which is 649,000 less than the Establishment Survey. Variations in calculations and methodologies combined with adjustments such as the Birth/Death Adjustment and the seasonal adjustment make for often misconstrued data. (See The Details for complete explanation) Some pundits are saying the strong jobs number counteract any talk of a recession. However, in the last chart below from Charles Schwab, the 1960 and 1973 recessions were both preceded by similar jobs numbers.
Please continue to The Details for more of my analysis.
“I don’t make jokes. I just watch the government and report the facts.”
–Will Rogers
The Details
Last week the Bureau of Labor Statistics (BLS) issued their report on the employment situation. Payroll growth appeared strong according to the Establishment Survey, increasing by 339,000. Many pundits took this number and ran with it. Their conclusion, the economy cannot be in a recession with such a large monthly payroll increase. In this missive, I will examine data surrounding the payroll situation and whether it is inconsistent with a recession.
One point receiving modest attention was the increase in the unemployment rate from 3.4% to 3.7%. Some might be wondering how the unemployment rate could increase if jobs increased by 339,000. The answer is the jobs number is derived from the Establishment Survey, while the unemployment rate is calculated with data from the Household Survey. Each survey has a different and distinct definition of employment and different estimation methods. Notice in the chart below, an excerpt from the May Household Survey, the number of people employed decreased by 310,000. This is 649,000 less than the Establishment Survey. This result, combined with a slight increase in the number of potential workers not in the labor force, accounts for the increase in the unemployment rate.

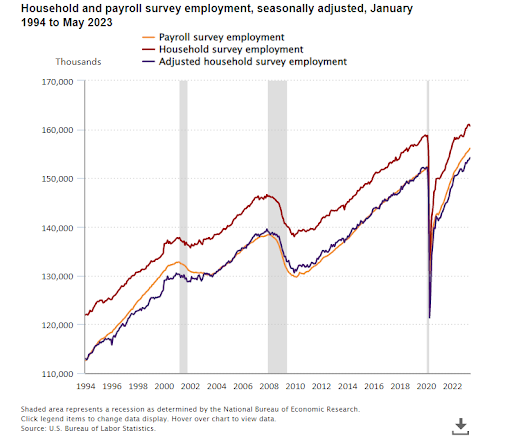
When comparing the employment level as reported by the Household Survey versus the Establishment Survey (also called the Payroll Survey), as shown in the graph below, the BLS states: “In the chart, the household survey employment level (the red line) is higher than that of the payroll survey (the orange line) because the household survey has a broader employment definition than the payroll survey…For research and comparison purposes, BLS creates an adjusted household survey employment research series (the blue line in the chart) that is more similar in concept and definition to payroll survey employment.”
Notice the orange line (Establishment Survey) has jumped above the blue line (adjusted Household Survey) recently. The BLS attempts to explain these temporary divergences in their discussion of survey differences here https://www.bls.gov/web/empsit/ces_cps_trends.htm.

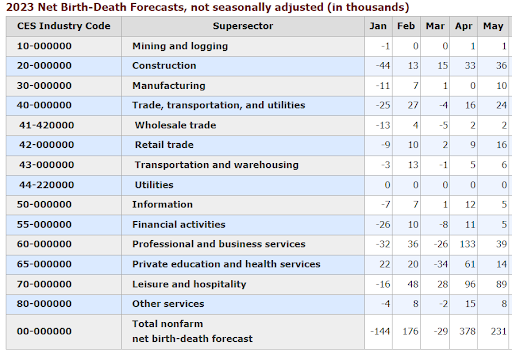
One of the differences between the employment numbers reported by the two surveys is the use of a Birth/Death Adjustment in the Establishment Survey. The Birth/Death Adjustment attempts to compensate for the tardiness of information regarding the impact on employment resulting from the startup of new businesses and the closure of existing businesses. This adjustment is computed on a “not seasonally adjusted” basis and combined with the other not seasonally adjusted data. Then the entire number is seasonally adjusted. Therefore, there is no way to extract the seasonally adjusted Birth/Death Adjustment. However, the “not seasonally adjusted” number can be seen in the chart below from the BLS.

So, a portion of the Establishment Survey’s seasonally adjusted payroll increase of 339,000 for May represents the seasonal modification for the Birth/Death Adjustment. Note that in May the not seasonally adjusted Birth/Death Adjustment was an increase of 231,000. It is somewhat hard to fathom that as the economy veers in or near a recession, and corporations appear to be cutting back, a net 231,000 new jobs were created from new businesses. Are people really starting that many new businesses today, as capital dries up and financing costs soar?
Overall, the results seem to look inconsistent. The one number (often seen as the most important number in the world for the stock and bond markets…at least for one day) viewed as critical, the Establishment Survey new jobs number, jumped by 339,000. Yet most investors do not realize that this number has been manipulated with a Birth/Death Adjustment and a seasonal adjustment. The Birth/Death Adjustment for May looks questionable in today’s economic environment. And most do not realize that the unemployment rate is calculated from the results of a separate survey, the Household Survey.
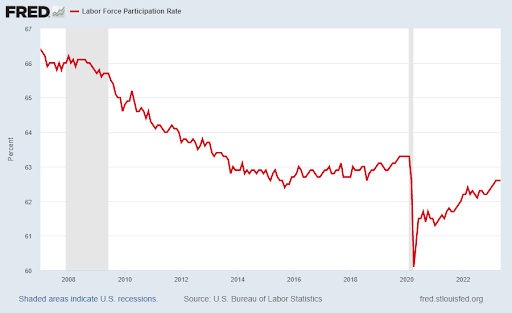
In the few years before the pandemic, the labor force participation rate, which had been falling for years, had begun to level off and climb slightly. Then when Covid19 arrived, the labor force plunged. Since bottoming in 2020, the labor force participation rate has been rising. However, as shown in the graph below, the rate has remained flat for the last three months. This is another sign of a cooling economy.

Many pundits claim that the U.S. cannot be in a recession with “job gains” of 339,000 and an unemployment rate of 3.7%. However, the chart below from Liz Ann Sonders of Charles Schwab illustrates the job gains or losses achieved the month a recession officially began. Notice the 1960 and 1973 recessions started with employment gains similar to that reported in May 2023.

The employment picture can be confusing when all of the data is examined. After factoring in the adjustments and different methodologies for different datapoints, the results are not always conclusive. And remember, the report is for the prior month. Employment numbers are lagging economic indicators. They can provide a good view of the trend of past payroll numbers. But too often too much attention is placed upon one month’s lagging results. The stock and bond markets often overreact to such data. However, over time the markets tend to digest the larger picture.
It cannot be definitively claimed that because May’s employment results appeared strong, that a recession is not in place or imminent.
The S&P 500 Index closed at 4,282, up 1.8% for the week. The yield on the 10-year Treasury
Note fell to 3.69%. Oil prices decreased to $72 per barrel, and the national average price of gasoline according to AAA dropped to $3.55 per gallon.
© 2023. This material was prepared by Bob Cremerius, CPA/PFS, of Prudent Financial, and does not necessarily represent the views of other presenting parties, nor their affiliates. This information should not be construed as investment, tax or legal advice. Past performance is not indicative of future performance. An index is unmanaged and one cannot invest directly in an index. Actual results, performance or achievements may differ materially from those expressed or implied. All information is believed to be from reliable sources; however we make no representation as to its completeness or accuracy.
Securities offered through First Heartland Capital, Inc., Member FINRA & SIPC. | Advisory Services offered through First Heartland Consultants, Inc. Prudent Financial is not affiliated with First Heartland Capital, Inc.

