Executive Summary
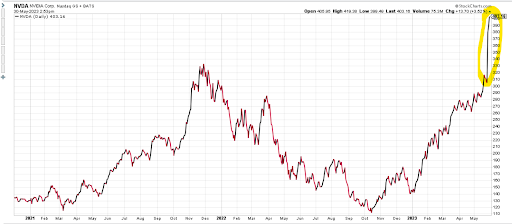
Recent market movements attributable to “AI” (artificial intelligence) are reminiscent of the 1990’s “.com” era. Recently, Nvidia, a graphics processor manufacturer, reported a fiscal first quarter earnings drop of 20% (year-over-year) with revenue down 13%. Yet the stock soared (see first chart below) because of multiple mentions of “AI” on the earnings call, along with the projection of 50% revenue growth for Q2. Time will reveal the accuracy of such a projection. Some investors may be surprised to know the Dow Jones Industrial Average is down almost 0.5% year-to-date. The equal weight S&P 500 is also slightly negative; however, the cap weighted S&P 500 and the NASDAQ are up due to a handful of stocks. When the mere mention of “AI” can send a stock soaring, the insanity has reached a fever pitch.
Please continue to The Details for more of my analysis.
“How do we know when irrational exuberance has unduly escalated asset values?”
–Alan Greenspan
The Details
In today’s missive I will show how the insanity in one stock can give the impression that all is well in the stock markets. Just as during the “.com” days of the late 1990’s, exorbitant valuations are being assigned this time to companies mentioning “AI” (artificial intelligence), especially Nvidia. Nvidia, a graphics processor manufacturer, recently released their quarterly earnings for fiscal Q1. The results: earnings fell about 20%, and revenue dropped around 13%. One would think the stock price would plummet, but instead it soared. The reason was in their investor call; they announced an almost unbelievable projected Q2 revenue growth of about 50%. Of course, this has yet to be seen. And they mentioned “AI” a bunch of times. And today, that’s all it takes to get Wall Street excited…talk of “AI.” Notice the price of Nvidia stock in the chart below.

At one point during today’s trading day, Tuesday, May 30, Nvidia reached a market cap (total shares outstanding times share price) of $1 trillion! Recent price action sent their price-to-earnings (P/E) ratio to a whopping 210, and a price-to-sales ratio of almost 40! These are numbers only seen during delusional bubbles. No consideration is being given to the obstacles in achieving their forecasted revenue numbers. Even if they hit their projections, the price would still be massively overvalued. A walk down memory lane with companies like Sun Microsystems, Oracle, Juniper Networks, JDS Uniphase are all that is required to understand how this ultimately ends.
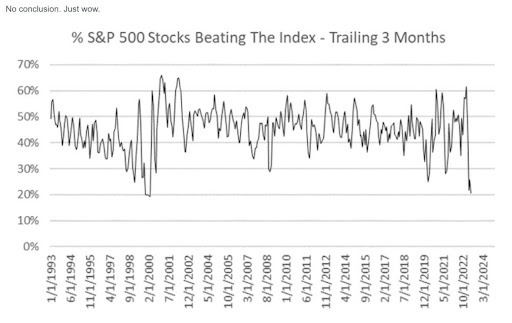
And for some perspective on how markets are really performing, the Dow Jones Industrial Average is down almost 0.5% year-to-date. The small-cap Russell 2000 is up about one-third of a percent. And as of the writing of this newsletter (Tuesday), the equal-weighted S&P 500 is down about one-third of a percentage point. A couple of graphs to drive home this “breadthless” market are below. First a graph from Michael Kantro illustrating the small percentage of S&P 500 companies beating the index. The current percentage is comparable to the top of the Tech Bubble in 2000.

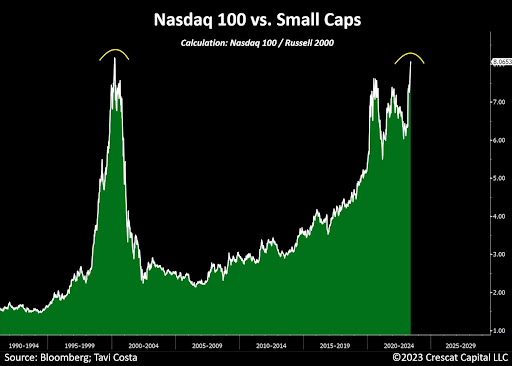
Next is a graph of the relationship between the Nasdaq 100 (tech index) to the Russell 2000 (small cap index). Again, the ratio hasn’t been this high since the top of the Tech Bubble. This ratio shows how overpriced the Nasdaq 100 is in comparison to the price of the Russell 2000.

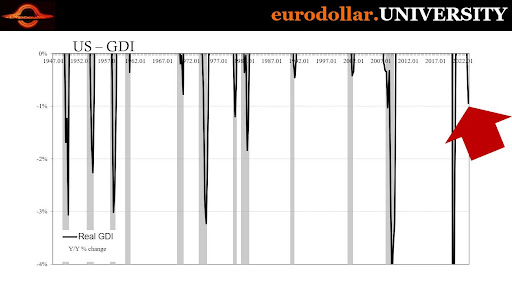
And while a few stocks are pushing the overall S&P 500 and Nasdaq 100 Indices higher, the economy could be in a recession. According to a Tweet by Jeffrey Snider, “Here’s recession confirmation & not later this year like Fed forecast. Recession already by Q1 before banking crisis. Real GDI down Y/Y. In 75yrs of data, it has NEVER happened outside recession (or immediately after). Happens IN EVERY contraction.”

So, the U.S. could be in a recession at this time. And the stock market is being lifted largely by one company, which showed falling revenue and earnings (year-over-year) last quarter. This is the time of the cycle when it is important to understand the big picture. Many are currently being fooled by the Nasdaq 100 and the S&P 500 into believing that the market is strong. Once excess valuations are bled from the market, many will look back and wonder why they suffered such losses. And the old saying, “Why didn’t I see that coming?” will be recited by many.
The insanity in the markets is reaching fever pitch!
The S&P 500 Index closed at 4,205, up 0.3% for the week. The yield on the 10-year Treasury
Note rose to 3.82%. Oil prices increased to $73 per barrel, and the national average price of gasoline according to AAA rose to $3.58 per gallon.
© 2023. This material was prepared by Bob Cremerius, CPA/PFS, of Prudent Financial, and does not necessarily represent the views of other presenting parties, nor their affiliates. This information should not be construed as investment, tax or legal advice. Past performance is not indicative of future performance. An index is unmanaged and one cannot invest directly in an index. Actual results, performance or achievements may differ materially from those expressed or implied. All information is believed to be from reliable sources; however we make no representation as to its completeness or accuracy.
Securities offered through First Heartland Capital, Inc., Member FINRA & SIPC. | Advisory Services offered through First Heartland Consultants, Inc. Prudent Financial is not affiliated with First Heartland Capital, Inc.

