Executive Summary
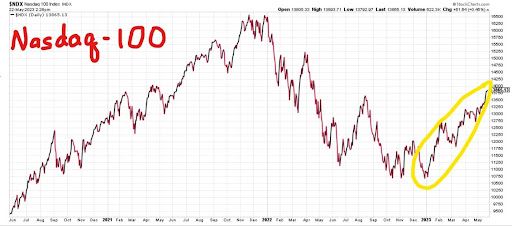
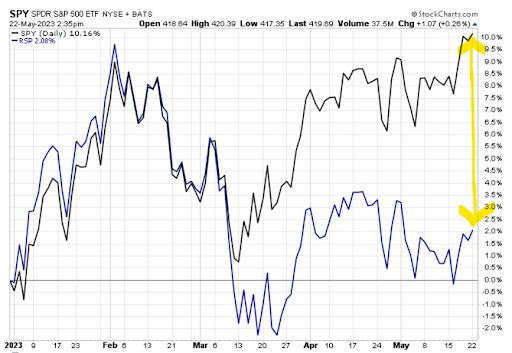
After losing around 34% throughout 2022, the Nasdaq 100 index has bounced nearly 30% off the lows. Most of this ramp is due to eight stocks, listed below with their corresponding P/E ratios, along with the return of fear of missing out (fomo). These stocks are also included in the S&P 500 Index, which moved higher because of this concentration of eight stocks. The second graph shows the difference in the S&P 500 (capitalization weighted) and the equal weighted S&P 500. While many want a return to a long-term bull market, the macro-economic environment, current debt levels, and high interest rates do not call for such a move. Instead, history will show this to be an extended bear market rally.
Please continue to The Details for more of my analysis.
“The fear of missing out on things makes you miss out on everything.”
–Etty Hillesum
The Details
After peaking in November 2021, the Nasdaq 100 Index, often referred to as the “Tech” Index due to its composition, plunged 34% by December 31, 2022. Many of the large leaders fell over 50%, and Meta (Facebook) was down almost 70%. Then, for some unknown reason, the Nasdaq 100 Index bounced about 30% off of its bottom. This jump is primarily due to eight large companies, which saw huge market losses last year. The bounce is not due to a change in fundamentals, but instead a return of speculative fever. The leap in these eight stocks has, once again, pushed valuations into the stratosphere.

The eight stocks and their current price-to-earnings (P/E) ratios are listed below.
Apple 30
Amazon 280
Alphabet (Google) 28
Meta (Facebook) 31
Microsoft 35
Netflix 43
Nvidia 180
Tesla 55
As explained in a previous newsletter, the S&P 500 Index is a “market cap-weighted” index. In other words, the companies with the largest market cap (stock price times shares outstanding) receive the largest allocation in the index. Because of this, these eight stocks constitute a significant portion of the S&P 500 Index. For instance, equally weighted, each stock would represent about 0.2% of the Index. However, Apple comprises about 14% of the Index. The return of massive speculation, pushing P/E’s to the moon, has also driven the S&P 500 Index up this year, returning to extreme valuations. The chart below compares returns for the year-to-date period of the S&P 500 (market cap-weighted) Index (SPY exchange-traded fund) to the Equal-weighted S&P 500 (RSP ETF). Notice almost all of the gains are attributable to speculation in the large market-cap stocks.

Upon seeing the overall S&P 500 Index rise this year, not realizing it is a market-cap weighted index pushed upwards by eight stocks, investors begin to get fomo (fear of missing out) and jump into the stock market. Stepping back, it is easy to identify the market movements as due to speculation (rising P/E ratios) versus fundamentals (rising earnings). The macro environment consists of an economy on the brink of recession with profit margins being squeezed by high prices, and tightening lending standards affecting corporations’ ability to borrow funds. Those who believe last year was the worst of the correction and are seeing clear skies ahead, have not examined the current economic reports.
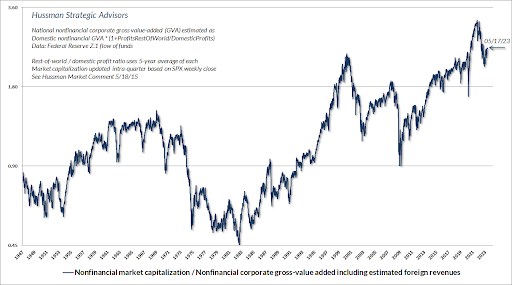
Yet, investor fomo has pushed stock valuations back to heights rarely seen in all of investing history. The following graph from economist John Hussman plots the valuation of the S&P 500 Index. The methodology used is similar in theory to a price-to-revenue ratio. Through testing, Hussman has determined this methodology is most correlated with actual future results. The current level of valuation exceeds that of the Tech Bubble in 2000 and is close to the heights witnessed just prior to the Great Depression.

The current fomo has temporarily given hope to those wanting a return to a long-term bull market. Unfortunately, the macro-economic environment combined with current debt levels and high interest rates do not call for such a move. Instead, history will show this to be an extended bear market rally. Some might call this Mega-cap Bubble 2.0. Speculators will flee this market as quickly as they arrived, once the focus returns to fundamentals.
The S&P 500 Index closed at 4,192, up 1.6% for the week. The yield on the 10-year Treasury
Note rose to 3.69%. Oil prices increased to $72 per barrel, and the national average price of gasoline according to AAA rose to $3.54 per gallon.
© 2023. This material was prepared by Bob Cremerius, CPA/PFS, of Prudent Financial, and does not necessarily represent the views of other presenting parties, nor their affiliates. This information should not be construed as investment, tax or legal advice. Past performance is not indicative of future performance. An index is unmanaged and one cannot invest directly in an index. Actual results, performance or achievements may differ materially from those expressed or implied. All information is believed to be from reliable sources; however we make no representation as to its completeness or accuracy.
Securities offered through First Heartland Capital, Inc., Member FINRA & SIPC. | Advisory Services offered through First Heartland Consultants, Inc. Prudent Financial is not affiliated with First Heartland Capital, Inc.

