Executive Summary
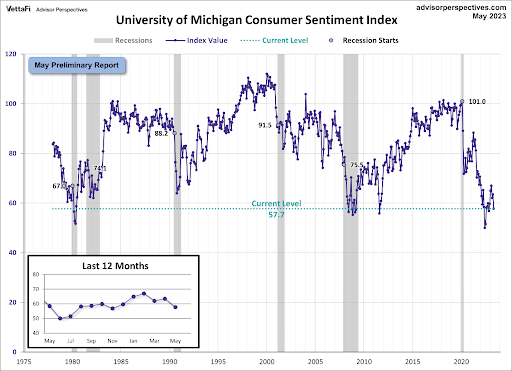
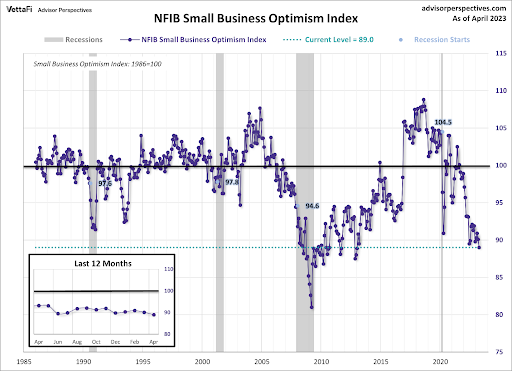
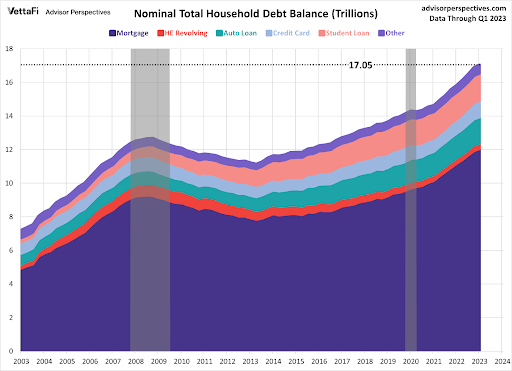
After over a decade of zero-interest rate policy, a pandemic, and massive government stimulus, inflation finally arrived with a vengeance on consumers. In the first graph, the University of Michigan Consumer Sentiment Survey reveals consumers do not feel good about the economy. It is at “bottom of recession levels,” not “pre-recessionary levels.” Small Business Optimism is also in the tank (2nd graph), and small business drives a large portion of the U.S. economy. Add in large increases in household debt (3rd graph) and higher interest rates (4th graph), and one can understand the struggling consumer. Government stimulus contributed to inflated home prices and car prices. Take increased credit card balances, student loan debt, along with house notes and car notes and households are feeling the weight of it all – especially with higher interest rates!
Please continue to The Details for more of my analysis.
“With all this consumer debt, business debt, government debt, smaller movements in interest rates have a magnified effect. A small movement can tip the boat.”
–Bill Gross
The Details
The U.S. is experiencing a dichotomy in economic data rarely seen. The situation is the product of over a decade of unprecedented monetary policy, combined with economic stimulus of such proportions that, in hindsight, makes one’s head spin. After almost 10 years of bubble formations resulting from zero-interest rate policy and trillions of dollars in created base money, a pandemic appeared. The economy shut down and the Federal floodgates opened. Household income jumped like never before. Families used their newfound wealth to buy overpriced cars and homes. However, like all things too good to be true, the faucet was quickly turned-off. The hangover from the Fed creating roughly $5 trillion in new base money – inflation – soared and continues at high levels today. With the Federal windfall now embedded in new cars and homes, households are returning to debt to make ends meet. Yet, at the same time, jobs appear to be plentiful. How long before the employment picture reflects the massive downturn in economic indicators? Likely, not much longer. With all that has transpired, how is the consumer faring?
According to VettaFi, “The Michigan Consumer Sentiment Index is a monthly survey of consumer confidence levels in the U.S. with regards to the economy, personal finances, business conditions, and buying conditions, conducted by the University of Michigan.” This is a big picture look as to how the consumer feels about the economy and their position in it. The recent drop to 57.7 puts the Index at levels usually seen at the bottom of recessions, far below readings seen at the start of many prior recessions, as shown in the graph below.
The U.S. economy is powered largely by small businesses. They employ almost half of all workers. Therefore, looking at the NFIB Small Business Optimism Index provides a good examination into what is expected from consumers. The recent drop in the Index puts it at a 10-year low, and also at levels far below those experienced in many prior recessions. It appears that small business owners believe the consumer is pulling back.
As mentioned above, with the disappearance of the Federal Government largess, households are returning to the use of debt. The graph below from VettaFi illustrates that Household Debt Balances have climbed to a record $17.05 trillion. This is broken down by debt type in the graph. This data is from the New York Fed using data from Equifax.
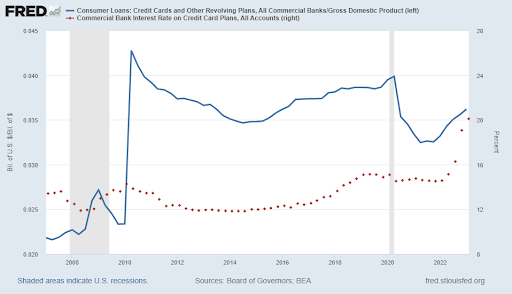
Some readers might be thinking it would be helpful to see household debt as a percentage of the overall economy. The blue line in the graph below shows just that. While the current level is below the recent post-pandemic reading, it is once again climbing at an alarming rate. And remains far above the pre-Global Financial Crisis level.
But the more concerning point is that interest rates on credit cards are soaring as shown with the red dots in the graph. These rates have skyrocketed over the past year.
A deeper dive into the details presents an even more concerning picture, although here too the data does not necessarily agree. According to the St. Louis Fed FRED database, household debt service payments as a percentage of disposable personal income equals around 10%. This by itself does not seem too alarming. However, according to Bankrate.com, the average monthly car note for a new car is just over $700 per month. The average used car note is about $526 per month.
The median home price in the U.S. has fallen recently but remains an elevated $436,800, as shown in the graph below.
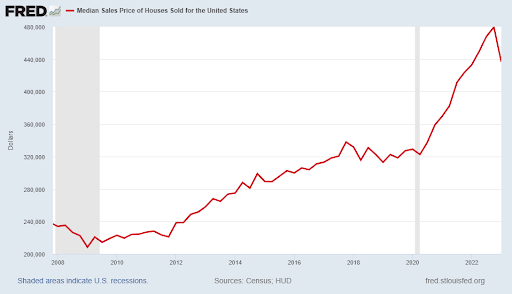
The monthly note for the median house price ($436,800) at 6% for 30 years is $2,619 per month excluding taxes and insurance. However, according to Rocket Mortgage, using a recent American Housing Survey by the U.S. Census Bureau, the median home price is $272,500. Of this amount, the survey assumes a loan size of $245,250. Using this lower number, the monthly payment would total $1,470 before taxes and insurance. Let’s assume another $600 per month for taxes and insurance, giving a total monthly payment of $2,070.
Now, assume a family of four recently purchased a house and one new car under the above circumstances. Their total monthly payment would be about $2,770. Over the course of a year, they would pay $33,240 merely for housing and one car. These numbers exclude any maintenance or upkeep costs. The real median household income in the U.S. is about $71,000. Let’s assume this family earns $100,000 per year or $29,000 above the median household income. Their household debt service, including one car note and a mortgage payment, is over 33% of their gross income – or over three times the St. Louis Fed number. And these calculations exclude credit card and student loan debt. If both parents maintain a credit card and student loans, this could easily add another $50-60,000 in debt.
The bottom line is the consumer is beginning to feel the weight of debt and higher interest rates. The evidence in the Michigan Consumer Sentiment Index and the NFIB Small Business Optimism Index confirm the expected slow down in consumer spending. Inflation and interest rates are taking their toll on consumer spending. And remember, consumer spending makes up close to 70% of overall economic activity. The consumer is starting to look concerned.
The S&P 500 Index closed at 4,124, down 0.3% for the week. The yield on the 10-year Treasury
Note rose to 3.46%. Oil prices decreased to $70 per barrel, and the national average price of
gasoline according to AAA dropped to $3.53 per gallon.
© 2023. This material was prepared by Bob Cremerius, CPA/PFS, of Prudent Financial, and does not necessarily represent the views of other presenting parties, nor their affiliates. This information should not be construed as investment, tax or legal advice. Past performance is not indicative of future performance. An index is unmanaged and one cannot invest directly in an index. Actual results, performance or achievements may differ materially from those expressed or implied. All information is believed to be from reliable sources; however we make no representation as to its completeness or accuracy.
Securities offered through First Heartland Capital, Inc., Member FINRA & SIPC. | Advisory Services offered through First Heartland Consultants, Inc. Prudent Financial is not affiliated with First Heartland Capital, Inc.
