Executive Summary
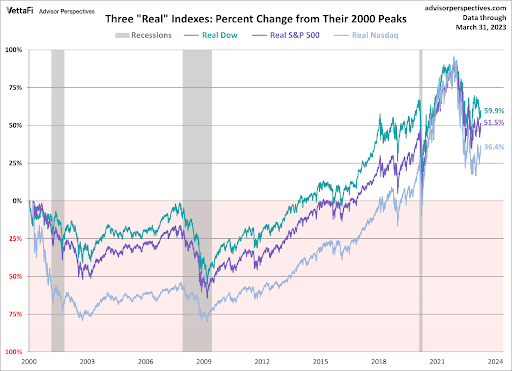
When inflation is running below 2% annually, it does not get much attention. However, last year when it hit 9%, it was on everyone’s mind. This issue looks at how inflation impacts the purchasing power of one’s savings. High inflation combined with market cycle downturns have a double whammy effect on savings. The second graph below looks at “real” or inflation adjusted returns from the year 2000 to current. One can clearly see the large market drops of the technology bubble and 2008 financial crisis on an inflation adjusted basis took 15-18 years to recover positive “real” returns. This underscores how detrimental large losses combined with inflation can be versus the impact of capturing all gains.
Please continue to The Details for more of my analysis.
“Inflation is the time when those who have saved for a rainy day get soaked.”
–Anonymous
The Details
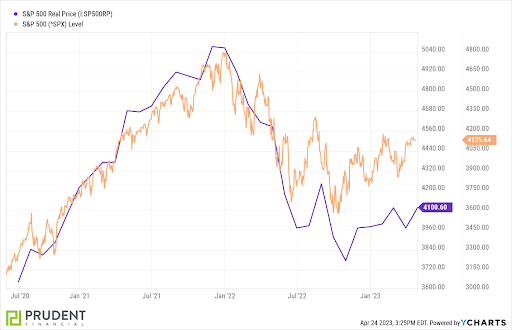
When inflation was running below 2% annually, it did not garner much attention from most people. However, when inflation soared to around 9% last year, it quickly became the topic of discussion. Although down from its peak, inflation around 5% today continues to burden most households. Oftentimes it is easy to forget about the impact inflation has on retirement savings, as most people focus merely on their current account balances. Looking back at inflation-adjusted numbers might open investors’ eyes to the significant impact inflation, especially the high inflation of today, can have on the purchasing power of one’s savings. The chart below illustrates that the market declines realized during the current bear market, combined with surging inflation, have eliminated S&P 500 returns achieved since late 2020 to present. Notice the gap between the nominal index versus “real” or inflation adjusted numbers.

The effect of inflation becomes more visible when looking at a longer time frame. Even after a prolonged period of extremely low inflation, the impact is still significant. The chart below from Advisor Perspectives shows the real (inflation-adjusted) cumulative returns for three indices: the S&P 500, the Dow Jones Industrial Average, and the NASDAQ, from their peaks in 2000 to present.

Notice in the graph above, it took around 18 years for the NASDAQ to recoup the losses attained during the Technology Bubble on an inflation-adjusted basis. And it took over 13 years for the DOW, and close to 15 for the S&P 500 to recoup the downturns. It is for that reason why I have written in the past that deep market losses can have a more dramatic impact on a portfolio versus catching all gains. If inflation existed at today’s levels over the post-2000 period, the recovery period would be even longer.
Isolating the S&P 500 Index, the chart below illustrates both nominal and real returns from March 24, 2000, through March 31, 2023. On a real basis, the average annual return for this 23-year period equals 3.47%. And it is important to note that the ending period remains highly elevated in a bubble yet to fully correct. In fact, considering the drop in corporate earnings, the bubble has hardly deflated. Combining the potential impact of valuations and inflation, if over the next couple of years, the bear market corrects such that valuations return to their long-term mean, and inflation remains around current levels, the real return from March 2000 to that date, approximately 25 years, could very likely produce negative real returns.

The inflationary impact upon investment returns can be astonishing, especially in times of high inflation. Combining falling returns during a bear market with the loss of purchasing power of inflation can produce a “double whammy” on one’s savings. When looking forward and attempting to forecast future return expectations on one’s retirement savings, it is important to incorporate the potential impact of inflation on the future purchasing power of those funds. Inflation secretly erodes one’s savings.
The S&P 500 Index closed at 4,134, up 0.7% for the week. The yield on the 10-year Treasury Note rose to 3.57%. Oil prices decreased to $78 per barrel, and the national average price of gasoline according to AAA remained at $3.67 per gallon.
© 2021. This material was prepared by Bob Cremerius, CPA/PFS, of Prudent Financial, and does not necessarily represent the views of other presenting parties, nor their affiliates. This information should not be construed as investment, tax or legal advice. Past performance is not indicative of future performance. An index is unmanaged and one cannot invest directly in an index. Actual results, performance or achievements may differ materially from those expressed or implied. All information is believed to be from reliable sources; however we make no representation as to its completeness or accuracy.
Securities offered through First Heartland Capital, Inc., Member FINRA & SIPC. | Advisory Services offered through First Heartland Consultants, Inc. Prudent Financial is not affiliated with First Heartland Capital, Inc.

