Executive Summary
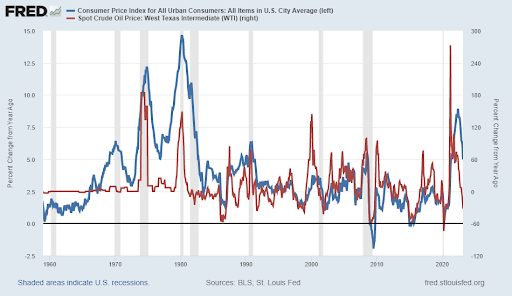
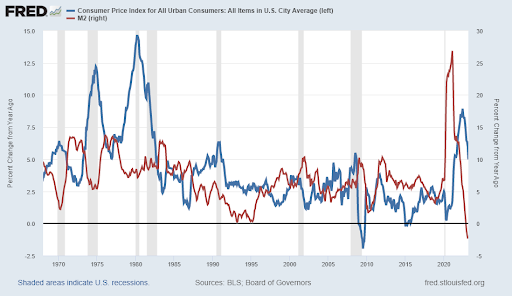
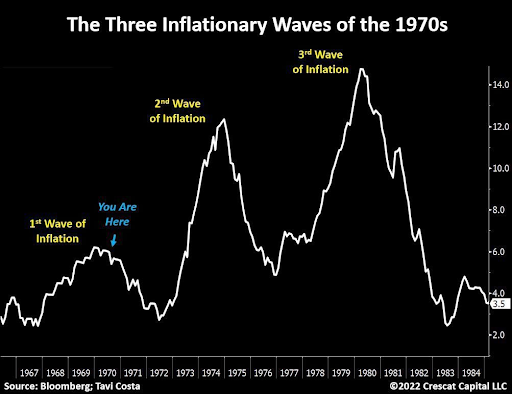
Due to technological advances, stock market data and trading are both more available and much faster. This leads investors to think things will immediately improve or anything negative is short-term. Take inflation, which is caused by either rising energy prices flowing through costs of products and services, or an increase in the money supply. Most analysts today look at the first two graphs below and conclude: since oil prices have dropped and the money supply contracted versus expanding, inflation will soon be back to “normal.” And thus, the Fed should stop raising rates. However, this “short termism” fails to see oil subsequently rose 21%. During the 1970’s, inflation came in three waves, each successive wave pushed higher. Speculators are hoping the Fed will succumb to short-termism and will cut rates, but history suggests otherwise.
Please continue to The Details for more of my analysis.
“You can’t build a long-term future on short-term thinking.”
–Billy Cox
The Details
One byproduct of technological advancements in financial markets is “short-termism.” With algorithms trading in nanoseconds and buy-the-dippers jumping in every time the market falls, investors have come to believe that the impact of any negative news won’t last long. Whether economic or market related, investors now expect almost immediate improvement no-matter the issue. Some of this “short-termism” is due to the fact that a vast majority of financial “experts” are so young, they have never experienced a full cycle. Those with a few gray hairs realize that cycles consist of two phases.
Of late, the focus seems to surround the length of the current inflation cycle and the Federal Reserve Bank’s (Fed’s) actions. Pundits hoping the bubble in stock prices will last longer, expect the Fed to stop raising interest rates. Conditioned over the past decade to believe the stock market will always react favorably to less-tight monetary policy, they are positioned for a return of the bull. Those gray-haired analysts realize, however, that during the past two bear markets, the Fed lowered rates the entire time markets plummeted. There are more ingredients to the mix this time. A near-recessionary economy, higher interest rates, record levels of debt, falling corporate earnings, and stubbornly high inflation.
Inflation is typically caused by either high and rising energy prices which filter through to many other products and services (cost-push), or an increase in the money supply. The U.S. experienced both. The first chart below plots the change in the Consumer Price Index (CPI) against the spot price of West Texas Intermediate (WTI) Crude Oil. The second shows the CPI versus the money supply as represented by M2.


Most analysts today look at the two graphs above and conclude that since oil prices have dropped and the money supply contracted versus expanding, inflation will soon be back to “normal.” And thus, the Fed should stop raising rates. However, investors should also consider that the rate and speed of the massive increase in both oil and M2 during the pandemic was unprecedented. Therefore, one would expect that the rate of change would drop significantly, at least for a brief period of time. Yet, since the price of oil bottomed last month around $66.74 per barrel, it has jumped a whopping 21% to $81 per barrel.
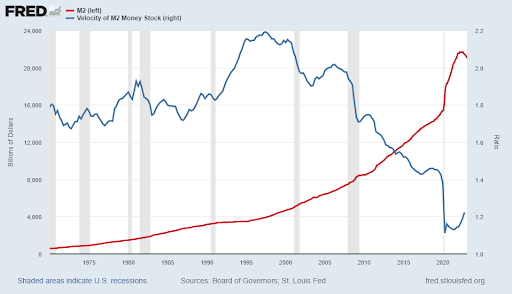
Looking at the money supply “stock” versus the “rate of change” shows a level 2.82 times larger than the level existing just before the Great Recession began in 2007. And the velocity of money (how often a dollar changes hands) is rising. Therefore, is it “short-termism” to conclude that since the change in CPI is downward, oil prices fell and M2 is contracting that inflation is conquered? Possibly, considering oil prices have since risen 21% and the stock of M2 remains far above the prior trend in the money supply.

Attempting to react too quickly could result in a similar occurrence as experienced during the 1970’s. During the 70’s, inflation came in three waves. In between the second and final wave the U.S. experienced disinflation, similar to today. However, each successive wave pushed inflation higher than before. See the graph below prepared by Tavi Costa.

Only time will tell how the current scenario works out. It is my belief that the Fed might be concerned about succumbing to “short-termism” and could continue raising rates, despite the drop in the change in the CPI. This is not what speculators are hoping for, and not what the stock market has priced in.
The S&P 500 Index closed at 4,105, up 0.8% for the week. The yield on the 10-year Treasury Note rose to 3.52%. Oil prices increased to $83 per barrel, and the national average price of gasoline according to AAA rose to $3.67 per gallon.
© 2021. This material was prepared by Bob Cremerius, CPA/PFS, of Prudent Financial, and does not necessarily represent the views of other presenting parties, nor their affiliates. This information should not be construed as investment, tax or legal advice. Past performance is not indicative of future performance. An index is unmanaged and one cannot invest directly in an index. Actual results, performance or achievements may differ materially from those expressed or implied. All information is believed to be from reliable sources; however we make no representation as to its completeness or accuracy.
Securities offered through First Heartland Capital, Inc., Member FINRA & SIPC. | Advisory Services offered through First Heartland Consultants, Inc. Prudent Financial is not affiliated with First Heartland Capital, Inc.

