Executive Summary
This week I wanted to share a guest article from Wolf Richter.
This article reflects on trends that we typically use to measure our economic position – services, goods, energy, or groceries – and how they pertain to consumers, and how their current positions can be used to understand how much or how little inflation we are facing. To hear what his interpretations of these trends are, be sure to read the guest article.
Please proceed to The Guest Article.
The Guest Article
“Services Inflation Rages at Worst Rate since 1984, Keeps “Core PCE” (Fed’s Yardstick) in High Range. Energy & Goods Cool”
Nearly two-thirds of consumer spending goes to services. That’s where the inflation action is.
Energy prices continued to drop, and prices of some goods dropped from the crazy spike in 2021, and food prices are increasing at a more moderate rate. We have seen these trends for months. But the element that makes up nearly two-thirds of consumer spending – services – the element that the Fed has been pointing out for months, remained at the worst level since 1984, and it kept core inflation at nose-bleed levels at well over twice the Fed’s target.
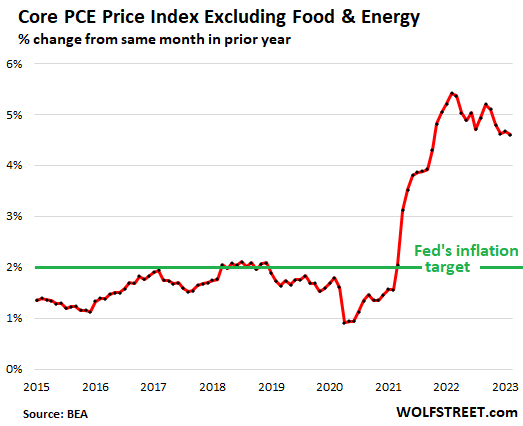
Core PCE price index: the yardstick for the Fed’s inflation target.
On a year-over-year basis, the PCE price index without food and energy products (“core PCE”) jumped by 4.6% year-over-year in February, after having jumped by 4.7% in January, and by 4.6% in December, essentially unchanged for the past three months, according to the Bureau of Economic Analysis today. The Fed’s inflation target is 2%, and it uses this core PCE index as primary yardstick.
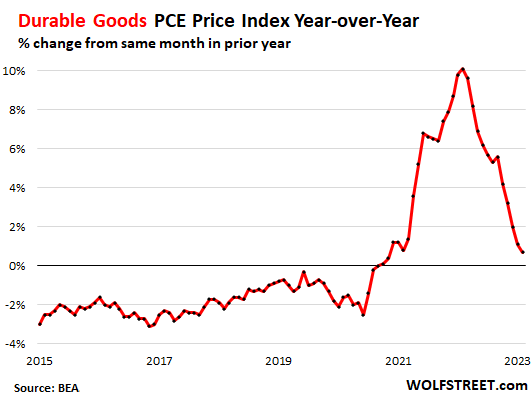
Within the core PCE index, the PCE price index for durable goods rose just 0.7% year-over-year, but the PCE index for services spiked by 5.6%.
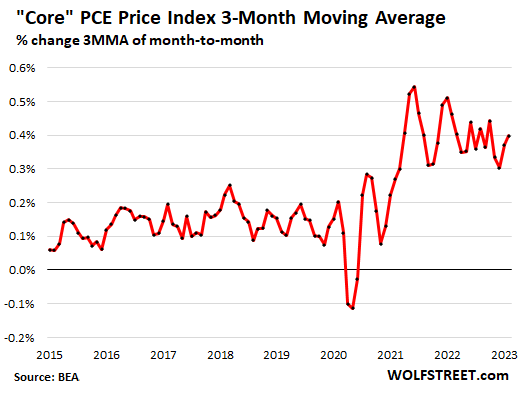
On a month-to-month basis, the core PCE price index has been jumping up and down in the same range since 2021. In February, it rose 0.3%, after the 0.5% jump in January and 0.4% in December.
This chart shows the three-month moving average of core PCE’s month-to-month changes, which smoothens out the month-to-month volatility and shows the trends more clearly:
Inflation continues to rage in services.
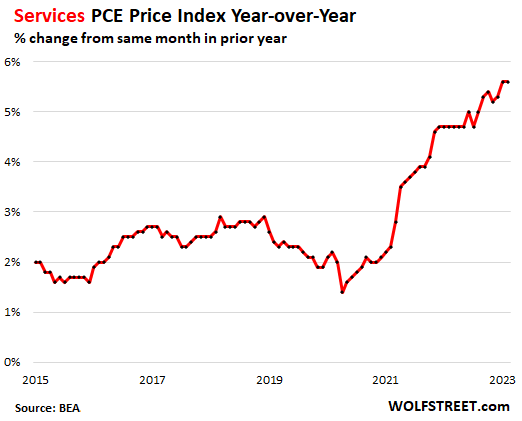
Powell, in every press conference since mid-2022, has been pointing at the services components of the PCE price index as the hotspot of inflation, where inflation is raging, and where it is very difficult to extinguish. Services account for nearly two-thirds of consumer spending.
The PCE price index for services jumped by 5.6% year-over-year in February, same as in January, and both are the worst since 1984:
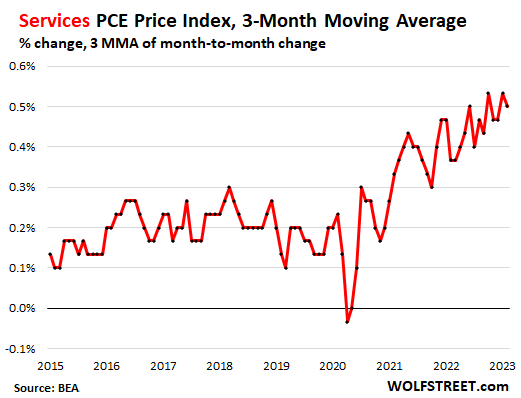
On a month-to-month basis, the PCE price index for services jumped by 0.3% in February from January, and has been jumping up and down in the same high range since 2021. The chart shows the three-month moving average, which smoothens out the month-to-month volatility and shows the trends more clearly:
Durable goods prices cool from the crazy spike.
The PCE price index for durable goods – new and used vehicles, appliances, furniture, electronics, etc. – dipped by 0.2% in February from January, having been in the same range above and below the zero-percent line for a year, after the huge spikes from late 2020 through 2021.
This brought year-over-year durable goods inflation down to just 0.7%. A big driver in this has been the sharp decline in used vehicle prices from the crazy spike in 2021:
The PCE price index for energy fell 0.4% month to month, which pushed down the year-over-year increase to 6.4%, the least terrible jump in two years, and down from the +30% range in mid-2022.
The PCE price index for food rose 0.2% in February from January, which pushed down the year-over-year increase to 9.4%, the least terrible since April 2022, down from the double-digits in between.
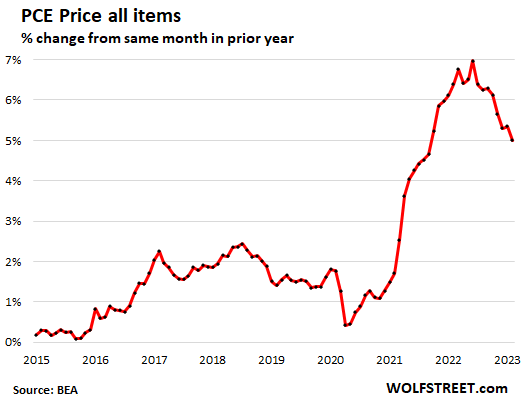
The overall PCE price index for all items rose by 0.3% in February from January, and by 5.0% year-over-year:
Please share your thoughts on this guest article with me on Facebook, LinkedIn, and Twitter, I can’t wait to share my thoughts with you next week!
© 2022. This material was prepared by Bob Cremerius, CPA/PFS, of Prudent Financial, and does not necessarily represent the views of other presenting parties, nor their affiliates. This information should not be construed as investment, tax or legal advice. Past performance is not indicative of future performance. An index is unmanaged and one cannot invest directly in an index. Actual results, performance or achievements may differ materially from those expressed or implied. All information is believed to be from reliable sources; however we make no representation as to its completeness or accuracy.
Securities offered through First Heartland Capital, Inc., Member FINRA & SIPC. | Advisory Services offered through First Heartland Consultants, Inc. Prudent Financial is not affiliated with First Heartland Capital, Inc.

