Executive Summary
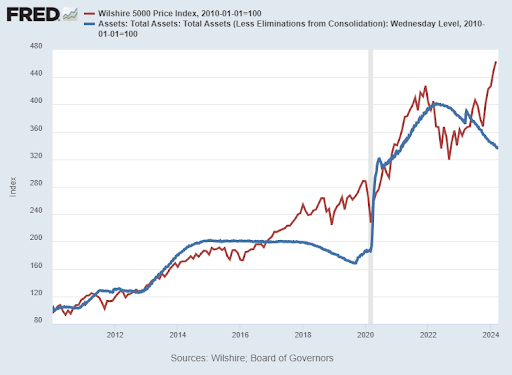
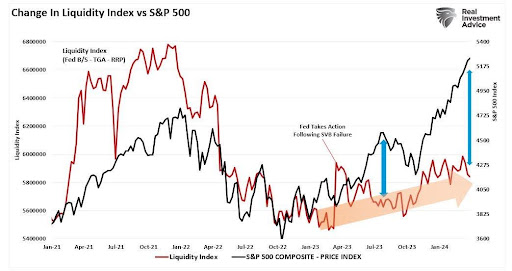
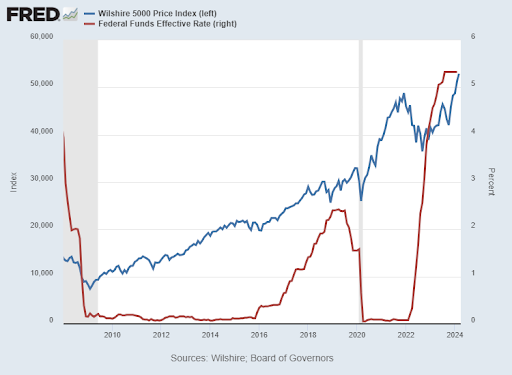
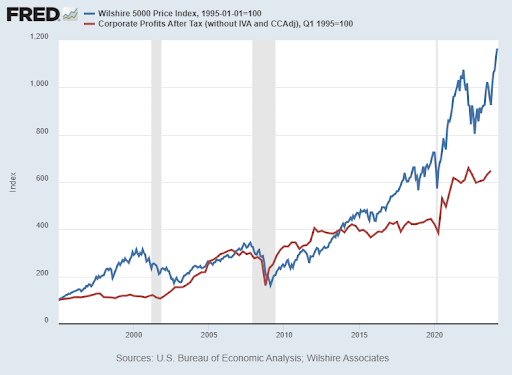
Some of the reasons used to justify the recent stock market bull market and bubble include: “Don’t fight the Fed,” too much liquidity in the market, zero percent Fed Funds rate, and corporate profits. The first graph shows how the Fed is tightening while the market has risen – undermining the “Don’t Fight the Fed” mantra. The second shows the disconnect between liquidity and stock prices. Anticipation of the Fed cutting rates has been used as justification for market increases since October 2023 – yet there have been no cuts. And the last graph shows how corporate profits were relatively flat from 2013-2019 and have since reacted to the pandemic and related government programs for pandemic recovery. Correlation does not mean causation, even when used to justify speculation in market extremes. However, it seems investor psychology is the key. Once investor psychology changes from speculation, things change rapidly (i.e. Great Depression, Technology Bubble and Financial Crisis).
Please continue to The Details for more of my analysis.
“For some reason, because of the way investor psychology works, people switch from only seeing the good to seeing only the bad.”
–Howard Marks
The Details
Ask five experts why the stock market has risen since the Financial Crisis in 2008-2009, and you will probably get five different answers. While each one of the reasons provided might have contributed to the formation of the largest stock market bubble in history, the main contributor is usually excluded from the discussion. In this missive, I will review some of the most frequently cited justifications for the rise in markets.
The reason most often stated refers to the adage, “Don’t fight the Fed.” The specific data used for this explanation involves comparing the rise in the stock market with the rise in the Fed’s balance sheet. This visually appeared to make sense until the period of 2017 through 2019. Then, the massive QE (Quantitative Easing) and stimulus response to the pandemic seemed to bring things “back in line” as shown in the graph below. However, the tremendous rally since October of last year seems to contradict this reasoning. The Fed has been implementing Quantitative Tightening or shrinking their balance sheet while markets skyrocketed.
Some analysts decided to get more granular and adjusted the Fed balance sheet, calculating a “liquidity index.” While most liquidity indices are similar in formulation, there are differences depending upon who created the index. The graph below from economist Lance Roberts of Real Investment Advice takes the Fed’s balance sheet (blue line above) and subtracts both the Treasury’s General Account, or the checking account for the Federal Government, and the balance of reverse repos (a discussion for another newsletter).
The graph below clearly illustrates the massive disconnect between the stock market and the liquidity index, especially since October 2023.
Maybe there is more to it than merely the Fed’s assets or some derivation thereof. Some say the bull market and bubble are the direct result of the Federal Funds Rate (FFR) established by the Fed. Many believe lowering interest rates to near zero percent justifies higher stock prices. And while it is true, in a present value calculation, when the discount rate is lowered, the present value is higher. The problem with that reasoning is the time period involved. Stock prices represent the present value of a very long-term stream of income. “Long-term” or duration for stocks should be more like 50 years, whereas low rates as determined by the Fed are more variable and potentially represent a much shorter time period. Notice in the graph below, the Fed Funds Rate was dropped to around zero after the Financial Crisis and remained there through 2015, when the Fed began raising rates.
Some saw zero percent rates as a reason for high stock allocations. Others saw it as the only viable alternative, ignoring the potential risk involved in holding overpriced stocks. Notice, despite some bumps in the road, stocks did not sell-off until 2018, even though rates began rising in 2015. The Fed then halted rate hikes and soon thereafter began lowering the FFR. Shortly after that the pandemic hit, and the Fed went back “all-in” lowering rates back to near zero percent and implementing QE. Markets soon took off again before tumbling in 2022. With rates flat as of August 2023, the markets leaped beginning in October 2023. Some say it was due to the “anticipation” of the Fed lowering rates again. But no such drop in rates has occurred.
Some financial pundits attribute the last bull market and current bubble to rising corporate earnings. However, as shown in the graph below, earnings (in red) pretty much flat-lined in 2013 through 2019, while the stock market soared. After falling during the pandemic, earnings soon rose rapidly due to the massive pandemic hand-outs. This too has come to an end, yet the market continues its bubble activity.
It is easy to use hindsight to attribute causality. However, as is correctly stated, correlation does not necessarily mean causation. One can stand at an intersection and bang on a drum until the streetlight turns red and the cars stop. Does that mean the drum caused the light to change? In my opinion, the real reason for the last enormous bull market and historic bubble was not due to Fed asset purchases, low interest rates or corporate earnings. While these indirectly contributed to the actions of investors, the real culprit is investor psychology. When investors determine they want to speculate, they do it. Some might use the Fed balance sheet or liquidity indices to maintain their mindset. Others might look at interest rates, and others, earnings. Or it could be a combination of the above that gives investors the desire to gamble in historically overpriced markets.
But, when these same investors determine they no longer desire to participate, for whatever reason, and begin selling, things unravel fast. And the greater the bubble, the further and faster the fall. Being that markets, by many measures, are at all-time extremes, the correction, once speculators’ mindset changes, could be devastating. One can examine market behavior after psychology changed at the end of previous bubbles. The DOW fell 89% in the bear market following the October 1929 crash. Technology stocks represented by the Nasdaq-100 Index fell 83% in the bursting of the Technology Bubble from 2000-2002. The Financial Crisis took the S&P 500 down close to 50%.
There is always something that can be pointed to in order to justify gambling activity in the stock market. However, it is the mindset of speculators that determines their ultimate actions. This can change on a dime.
The S&P 500 Index closed at 5,254, up 0.4% for the week. The yield on the 10-year Treasury
Note fell to 4.19%. Oil prices rose to $83 per barrel, and the national average price of gasoline according to AAA increased to $3.54 per gallon.
© 2023. This material was prepared by Bob Cremerius, CPA/PFS, of Prudent Financial, and does not necessarily represent the views of other presenting parties, nor their affiliates. This information should not be construed as investment, tax or legal advice. Past performance is not indicative of future performance. An index is unmanaged and one cannot invest directly in an index. Actual results, performance or achievements may differ materially from those expressed or implied. All information is believed to be from reliable sources; however we make no representation as to its completeness or accuracy.
Securities offered through First Heartland Capital, Inc., Member FINRA & SIPC. | Advisory Services offered through First Heartland Consultants, Inc. Prudent Financial is not affiliated with First Heartland Capital, Inc.
