Executive Summary
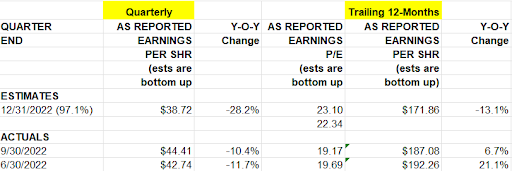
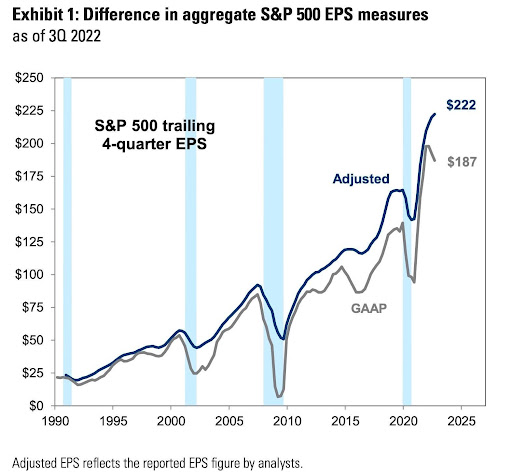
Generally Accepted Accounting Principles (GAAP), the standards for financial reporting, used to be used in financial analysis. However, now the financial industry prefers “adjusted” or “forward” earnings as they allow for manipulations, justifying overpriced stocks. One can see in the second graph below the divergence between S&P 500 Adjusted and GAAP EPS. In addition to EPS variations, there are different approaches used to report price-to-earnings ratios. In the first chart below one can see fourth quarter 2022 EPS were down 28%. However, since the December 2021 market peak, prices are only down 16%. The long-term median S&P 500 (GAAP) P/E is about 14.9. At around 23 today, the P/E remains about 55% above the long-term median. So, while variations exist in calculating ratios and earnings, one can see bubble pricing still exists!
Please continue to The Details for more of my analysis.
“The closer reported earnings are to GAAP, the more confident I’d be that investors are getting a fair characterization.”
–Jack Ablin, CIO at BMO
The Details
Ask three financial advisors what earnings-per-share (EPS) are for the S&P 500, and one will likely get three different answers. Over time, the financial industry moved away from using earnings derived by utilizing Generally Accepted Accounting Principles (GAAP) and began incorporating “adjusted” and/or “forward” earnings. “Adjusted” earnings are GAAP earnings adjusted for non-recurring or extraordinary items. “Forward” earnings are analysts’ best guess as to future earnings. Wall Street uses non-GAAP earnings because they can use manipulated numbers to justify overpriced stocks.
Recently, I asked a research firm reporting different earnings results than I was showing, where their numbers were derived. Their answer “Bloomberg.” There are several large firms that provide numbers for the industry, Bloomberg, FactSet and Yardeni, to name a few. When reporting earnings, none of these companies refer to GAAP earnings as their first choice. This makes it confusing for both financial analysts and investors to understand reality. Many are not thoroughly educated in the preparation of financial statements and the presentation of earnings. For example, the chart below was obtained directly from the S&P 500 website (spglobal.com). This chart shows quarterly and trailing 12-month earnings for the companies included in the S&P 500. The numbers are based upon GAAP earnings. (Change %, my calculation)

The graph below shows consensus “Adjusted” versus GAAP EPS, as of the end of the third quarter 2022. Notice the growing divergence between adjusted and GAAP EPS.

Just as there are different approaches used to report net earnings, there are many methodologies used to report price-to-earnings ratios (P/E). P/E ratios are often the basis for estimating whether the stock market is over or undervalued. The P/E is comprised of the “Price” of the S&P 500 or other security, divided by EPS. Some formulas use forward EPS, others such as the Shiller P/E, or CAPE (Cyclically Adjusted P/E), use 10-year average inflation-adjusted earnings for the denominator. “Price” is fixed and easily determined. The EPS used in the denominator is where the formula varies.
Have bubble valuations for the S&P 500 been eliminated based upon the current P/E? In this discussion, I will focus on the P/E using 12-month trailing GAAP EPS and the Shiller P/E. I have written numerous missives delving into record high stock market valuations. In this newsletter I only want to review what has occurred since the market topped in December 2021. Since peaking, the S&P 500 has only fallen about 16%. However, notice in the first chart above, EPS in the fourth quarter 2022 are down a whopping 28% versus the same quarter in the prior year. EPS have plummeted over the past year. Based upon the current economic environment, no recovery in EPS is projected in the near-term. In fact, earnings are expected to continue to drop.
So, recent EPS have fallen 28%, yet the market (S&P 500) is only down 16%. If bubble valuations existed at the market peak, then bubble valuations exist today. The long-term median S&P 500 (GAAP) P/E is about 14.9. At around 23 today, the P/E remains about 55% above the long-term median. The Shiller P/E is currently 29.4. The long-term median is 15.9; therefore, the Shiller P/E is 85% above the long-term median.
For consistency purposes and to eliminate confusion for investors – and financial advisors, I believe it is time for the industry to return to GAAP earnings. Based upon current GAAP EPS, both the 12-month trailing and Shiller P/E’s remain far above their long-term median. The bubble in stock prices remains in place.
The S&P 500 Index closed at 4,046, up 1.9% for the week. The yield on the 10-year Treasury Note rose to 3.96%. Oil prices increased to $80 per barrel, and the national average price of gasoline according to AAA rose to $3.40 per gallon.
© 2021. This material was prepared by Bob Cremerius, CPA/PFS, of Prudent Financial, and does not necessarily represent the views of other presenting parties, nor their affiliates. This information should not be construed as investment, tax or legal advice. Past performance is not indicative of future performance. An index is unmanaged and one cannot invest directly in an index. Actual results, performance or achievements may differ materially from those expressed or implied. All information is believed to be from reliable sources; however we make no representation as to its completeness or accuracy.
Securities offered through First Heartland Capital, Inc., Member FINRA & SIPC. | Advisory Services offered through First Heartland Consultants, Inc. Prudent Financial is not affiliated with First Heartland Capital, Inc.

