Executive Summary
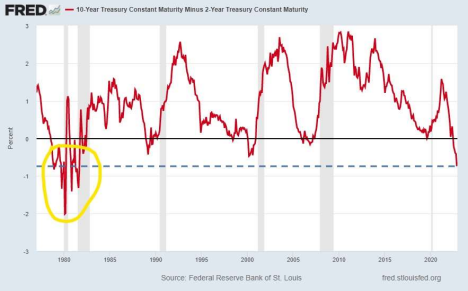
Normally, long-term interest rates are higher than short-term rates, and the yield curve is an upward sloping line. When short-term rates exceed long term rates, it is referred to as an “inverted yield curve.” Visually seen in the first graph below, the inverted yield curve preceded prior recessions. Real personal consumption, real disposable personal income, industrial production and nonfarm employment are four main datapoints determining a recession. None of which currently provide a 100% clear cut indication of recession. Both personal consumption and real disposable income appear to be falling (3rd and 4th graphs) while industrial production rate of growth remains positive (5th graph). And then employment, a lagging indicator, seems to remain strong as before prior recessions. Ultimately, time will tell…. along with the NBER.
Please continue to The Details for more of my analysis.
“Inflation is like toothpaste. Once it’s out, you can hardly get it back in again.”
–Karl Otto Pohl
The Details
Normally, long-term interest rates are higher than short-term rates. The comparison of rates is referred to as the yield curve and usually is represented by an upward sloping line. In most scenarios, the economy begins to run hot, so the Federal Reserve Bank (Fed) raises short-term interest rates to slow demand in hopes of avoiding inflation. Currently, however, the increase in demand was the direct result of unprecedented government stimulus. The surge in inflation came as a “surprise” to policymakers. The Fed, therefore, arrived late for the game and did not begin to raise rates until inflation was already established. The Fed only controls short-term interest rates. They attempt to control long-term rates through their QE (Quantitative Easing) programs; however, long-term rates tend to reflect economic growth and inflation.
Most economists look at the difference between the 10-year and 2-year Treasury Note interest rates to gauge the risk of recession. Notice in the graph below, the 10 and 2 year rates “inverted” (meaning 2-year rates were higher than 10-year rates) prior to each recession (shaded in gray). And the yield curve has not been this inverted (currently -0.74%), since the late 1970’s and early 1980’s.
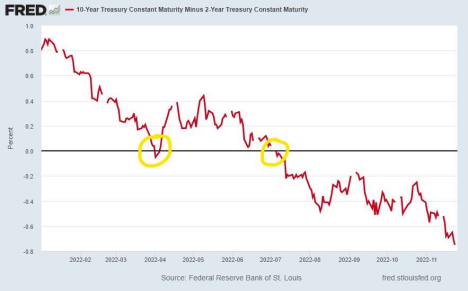
Closer inspection of the 10-2 yield curve reveals the start of a recession usually occurs after the yield curve has “uninverted,” or the 2-year rate has dropped back below the 10-year rate. Much debate has occurred recently about whether the two consecutive quarterly drops in annualized month-over-month real GDP in the first and second quarters of this year constitute the start of a recession. Some analysts focus on the fact that the yield curve is still inverted to claim a recession has not begun. Of course, a detailed look at the yield curve this year shows it inverting in April and then “uninverting” shortly thereafter. Then in July the curve again inverted. Was this initial “uninversion” in April a signal of a recession? Only time (and the NBER will tell). See the graph below.
A brief glance at four of the main datapoints used to determine a recession provides evidence that is not clear cut in either direction. These points include real personal consumption, real disposable personal income, industrial production and nonfarm employment.
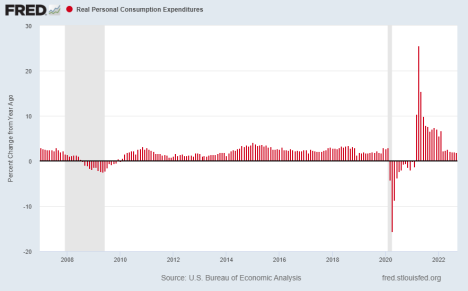
The first graph of real personal consumption expenditures reveals consumers are slowing their purchasing. With the stimulus funds exhausted and inflation high, it makes sense that spending is occurring at a lower rate. In the graph one can see the level of spending growth is about at the same level as prior to the last two recessions.
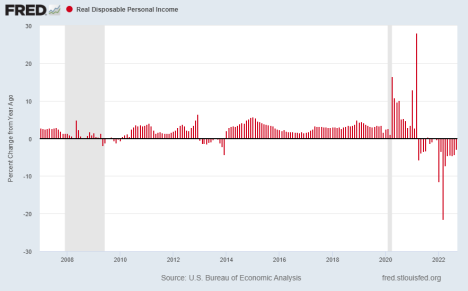
The elimination of government funds becomes more obvious when examining real disposable personal income. Real income has been mostly falling since April 2021.
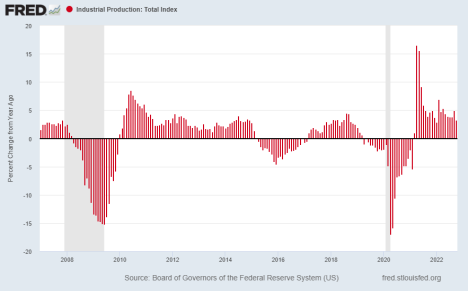
While the rate of industrial production has fallen, the rate of growth remains positive. The falloff in income and consumption will likely impact production in the near term.
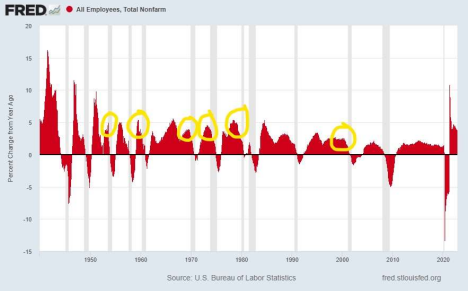
The one area which baffles many, showing strength, is in employment. And many economists refer to it when defending their position of “no recession”. The unique and unparalleled events and government response surrounding the pandemic led to a confusing employment scenario.
However, employment is often a lagging indicator. While employment growth remains high, notice in the graph below the other periods where employment growth was high just prior to the start of a recession. This alone is not proof of the absence of a recession.
The National Bureau of Economic Research (NBER) will eventually inform the public if and when an “official” recession has begun. The data appears in place to indicate the likelihood of a recession. However, it is possible the yield curve will not “uninvert” again until sometime next year. By then, weak economic growth should make it clear that a recession exists. Yet, we still might not know the “official” start date until declared by the NBER.
The S&P 500 Index closed at 4,026, up 1.5% for the week. The yield on the 10-year Treasury Note dropped to 3.70%. Oil prices fell to $76 per barrel, and the national average price of gasoline according to AAA decreased to $3.56 per gallon.
I always like to take a moment of my day to be grateful for the life I life and to think of new ways to help those around me.
With that being said, I’d like to invite you to join me in supporting St. Jude’s Children’s Research Hospital.
I am a St. Jude Hero! I have chosen to run for a reason bigger than myself by fundraising for the kids and families at St. Jude. I am training to cross the finish line on race day and with your donation, we can cross the fundraising finish line together because the money you donate helps find a cure for childhood cancer.
© 2021. This material was prepared by Bob Cremerius, CPA/PFS, of Prudent Financial, and does not necessarily represent the views of other presenting parties, nor their affiliates. This information should not be construed as investment, tax or legal advice. Past performance is not indicative of future performance. An index is unmanaged and one cannot invest directly in an index. Actual results, performance or achievements may differ materially from those expressed or implied. All information is believed to be from reliable sources; however we make no representation as to its completeness or accuracy.
Securities offered through First Heartland Capital, Inc., Member FINRA & SIPC. | Advisory Services offered through First Heartland Consultants, Inc. Prudent Financial is not affiliated with First Heartland Capital, Inc.

