Executive Summary
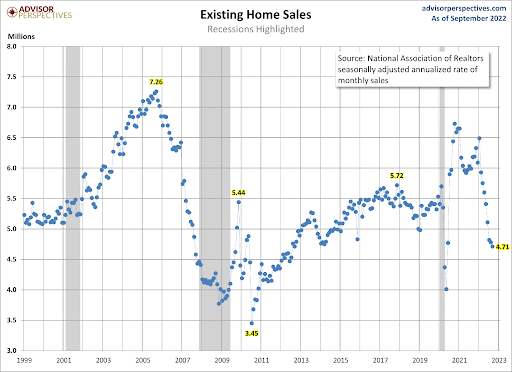
Soaring mortgage interest rates and falling personal disposable incomes are putting pressure on the housing market. When mortgage rates bottomed out around 2.75% and COVID-19 stimulus programs provided cash to households, home prices skyrocketed (see second graph). With current loan rates around 7.5%, monthly loan payments have increased about 71%. Those increases combined with decreases in disposable income resulting from high inflation are cooling home sales. As of September 2022, home sales have dropped to levels historically seen around recessions. While all the graphs show the developing changes in the housing market, the final graph shows the drastic extent the bubble could correct.
Please continue to The Details for more of my analysis.
“It is ludicrous to believe that asset bubbles can only be recognized in hindsight.”
–Michael Burry
The Details
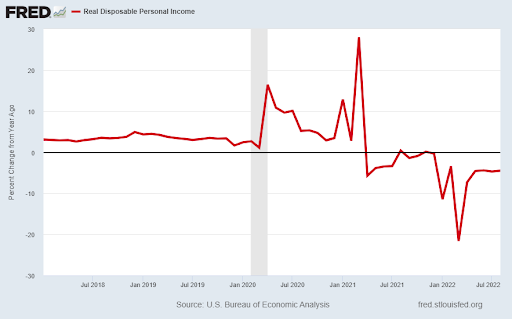
A combination of soaring mortgage interest rates and falling real (inflation-adjusted) personal disposable income is putting significant pressure on the housing market. Interest rates on a 30-year conventional loan bottomed out around 2.75% at the end of 2020. Since then, inflation has skyrocketed, and mortgage rates have jumped to around 7.5%. At the same time, the unprecedented stimulus payments distributed to households have stopped. After the stimulus payments ended, real personal disposable income, compared to the previous year, began falling in March 2021.
The massive plunge in home prices during the Financial Crisis, combined with stimulus programs enacted during and after this period, gave a boost to the real estate market leading to higher prices. This boost was turbo-charged with the incredible stimulus provided during the pandemic, as shown in the chart below.
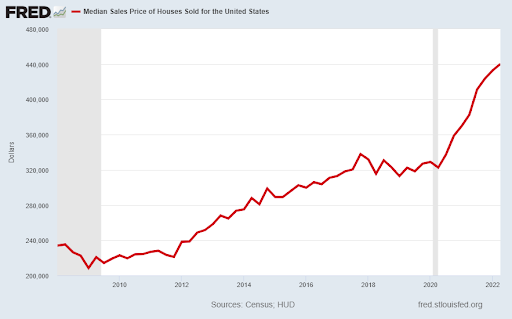
The median national home price peaked around $440,000. A purchaser of a $440,000 home who provided a 20% down payment ($88,000) and financed the balance ($352,000) with a 30-year mortgage, would have a monthly payment (excluding taxes and insurance) of $1,437 when rates were 2.75%. At a current rate of 7.5%, the same purchase would yield a monthly payment of $2,461, or an increase of 71% in monthly payments. This whopping increase in payments is what is putting the brakes on the real estate market.
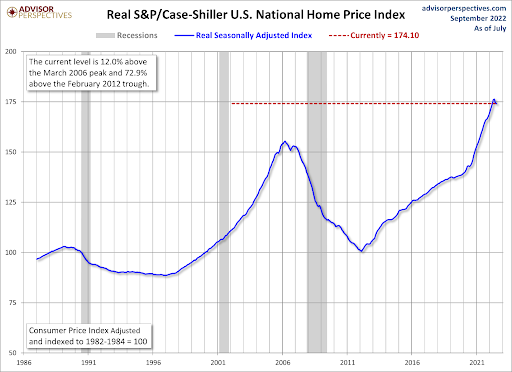
The problem with much of the data available for the real estate market is that it is lagging. For instance, the S&P/Case-Shiller U.S. National Home Price Index released in September is comprised of data through July. Although this is the most current data available, it is still three months old. In a rapidly changing real estate market, three months can be significant when analyzing data trends. The chart below, with data through July, shows real home prices beginning to turn the corner. I expect, with rates as high as they are, the drop-off in activity and prices could come swiftly.
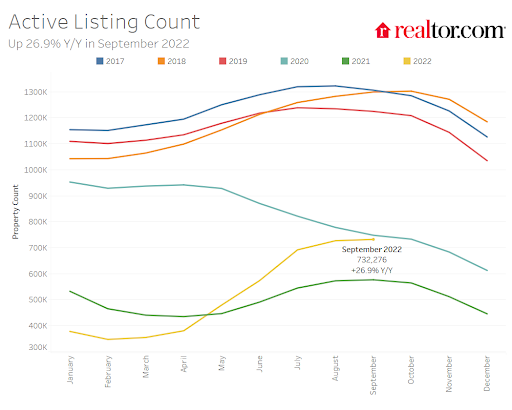
The graph below from realtor.com shows the inventory of homes for sale has been steadily rising during 2022 and has reached a level above all of 2021. While still far below 2017 and 2018, the longer interest rates remain high, the quicker 2022 inventory levels will approach 2017 readings.
As of September, the sales of existing homes have plummeted to a level at or below what has historically been seen around recessions.
And my favorite chart to provide a big picture view of the state of real estate bubbles, the following compares changes in home prices to changes in the Consumer Price Index (CPI). Over the long term housing prices tend to track the CPI. The real estate bubble peaking around 2007, together with the current bubble, are clearly evident below.
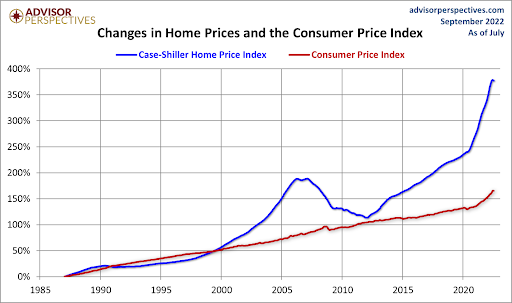
Although existing home sales are falling and inventory is growing, homes remain at near record high prices. Over time, high interest rates, falling real incomes and the impact of inflation on consumer spending will have a dramatic impact on home prices and the overall real estate market. The correction in housing has just begun.
The S&P 500 Index closed at 3,753, up 4.7% for the week. The yield on the 10-year Treasury Note rose to 4.21%. Oil prices fell to $85 per barrel, and the national average price of gasoline according to AAA decreased to $3.80 per gallon.
I always like to take a moment of my day to be grateful for the life I life and to think of new ways to help those around me.
With that being said, I’d like to invite you to join me in supporting St. Jude’s Children’s Research Hospital.
I am a St. Jude Hero! I have chosen to run for a reason bigger than myself by fundraising for the kids and families at St. Jude. I am training to cross the finish line on race day and with your donation, we can cross the fundraising finish line together because the money you donate helps find a cure for childhood cancer.
© 2021. This material was prepared by Bob Cremerius, CPA/PFS, of Prudent Financial, and does not necessarily represent the views of other presenting parties, nor their affiliates. This information should not be construed as investment, tax or legal advice. Past performance is not indicative of future performance. An index is unmanaged and one cannot invest directly in an index. Actual results, performance or achievements may differ materially from those expressed or implied. All information is believed to be from reliable sources; however we make no representation as to its completeness or accuracy.
Securities offered through First Heartland Capital, Inc., Member FINRA & SIPC. | Advisory Services offered through First Heartland Consultants, Inc. Prudent Financial is not affiliated with First Heartland Capital, Inc.

