Executive Summary
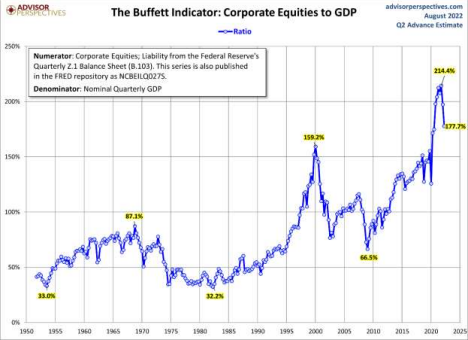
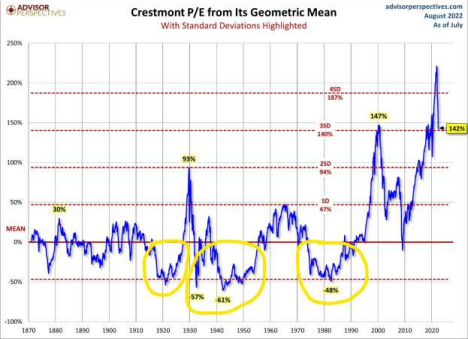
After falling about 23% for the year as of June 16th, the S&P 500 began a strong bear market rally of 17% (see first graph). Many pundits were calling the end of the bear, and the beginning of a new bull market. However, as shown below (third and fourth graphs), the market is still more overvalued than any time in history, including the 2000 Technology bubble. It may be time to review the last picture showing the “anatomy of a bubble.” New bull markets do not begin with near record high valuations, in markets dominated by speculators in an economy that is in or about to plunge into recession.
Please proceed to The Details.
“When all the experts and forecasts agree, something else is going to happen.”
–Bob Farrell
The Details
After falling about 23% for the year as of June 16th, the S&P 500 began a strong bear market rally. As explained in my August 2nd missive, bear market rallies are quite common during bear market cycles. The rally appears to have topped-off on August 16, after gaining 17% from the bottom, leaving the S&P 500 down around 10% year-to-date.
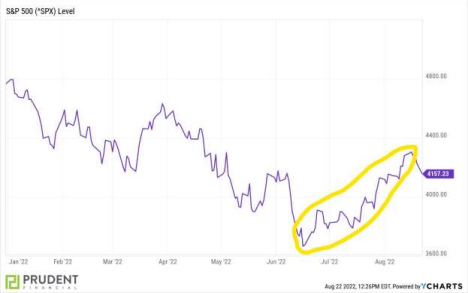
What I find amusing is that towards the end of the rally, a number of “experts” were actually questioning whether a new bull market had begun. These comments make me wonder whether these “experts” (some from well-known investment firms) are serving as cheerleaders instead of objective analysts. Have they reviewed historical bear market cycles? The purpose of a bear market is to burn-off the excesses built up during the previous bull market. As is normal, the bull market stretched far beyond what could be considered reasonable based upon corporate earnings and revenues. A complete bear market cycle should not only return valuations to the long-term average, but typically pull valuations below the mean. Afterall, if stock prices spend a long period above the mean, mathematically, to validate the mean, they must spend time below the mean. Stock valuations have not spent any measurable time below the mean since the late 1970’s and early 1980’s.
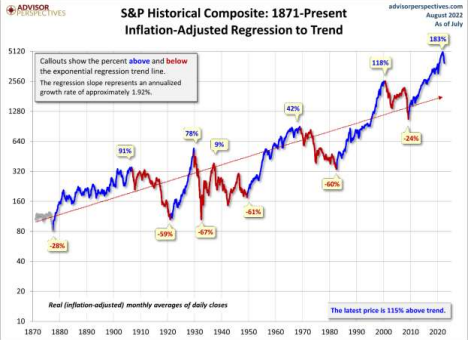
The fact that valuations, after the bear market rally, remain at or above the previous highest valuation level on record, at the peak of the Technology Bubble in 2000, should have provided the “experts” their first clue as to the progression of the current bear market cycle. Two valuation methods are shown below: The Buffett Indicator and the Crestmont P/E. These are consistent with methodologies most correlated with subsequent market results. Notice on the Crestmont P/E graph (second graph below), the areas circled in yellow highlighting the prior periods when the P/E spent time below the long-term mean.
Bear markets normally do not end until investors, having suffered immense damage, exit the markets vowing never to invest in stocks again. Effectively, they enter a period of despair as shown below in the “anatomy of a bubble.”
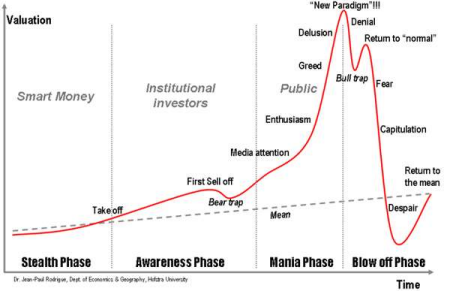
The recent bear market rally included many of the speculators on which this bubble was built. Speculators buying the riskiest, and often least profitable, stocks hoping to make a quick buck. There does not appear to be any fear or despair in the market yet. Also, the economy is in the early stage of a recession which has not been officially confirmed. As shown by the valuation charts shown above, stocks remain more overpriced now than in any previous bull market. New bull markets do not begin with near record high valuations, in markets dominated by speculators in an economy that is in or about to plunge into recession.
Despite the hopes of the cheerleaders, the recent bear market rally appears to be over. There remains a high risk of significant losses in stock prices, which remain at least one and one-half to two times above the mean. A drop below the mean would require an even greater drop. The bear market is still in its early stages.
The S&P 500 Index closed at 4,228, down 1.2% for the week. The yield on the 10-year Treasury Note rose to 2.99%. Oil prices fell to $91 per barrel, and the national average price of gasoline according to AAA fell to $3.90 per gallon.
© 2022. This material was prepared by Bob Cremerius, CPA/PFS, of Prudent Financial, and does not necessarily represent the views of other presenting parties, nor their affiliates. This information should not be construed as investment, tax or legal advice. Past performance is not indicative of future performance. An index is unmanaged and one cannot invest directly in an index. Actual results, performance or achievements may differ materially from those expressed or implied. All information is believed to be from reliable sources; however we make no representation as to its completeness or accuracy.
Securities offered through First Heartland Capital, Inc., Member FINRA & SIPC. | Advisory Services offered through First Heartland Consultants, Inc. Prudent Financial is not affiliated with First Heartland Capital, Inc.

