Executive Summary
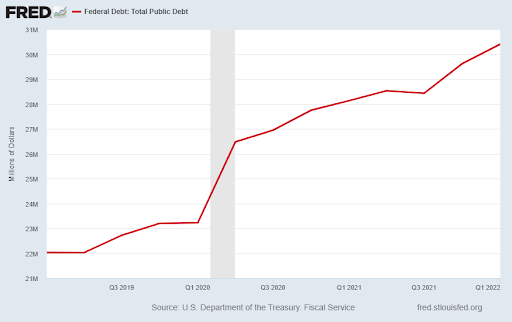
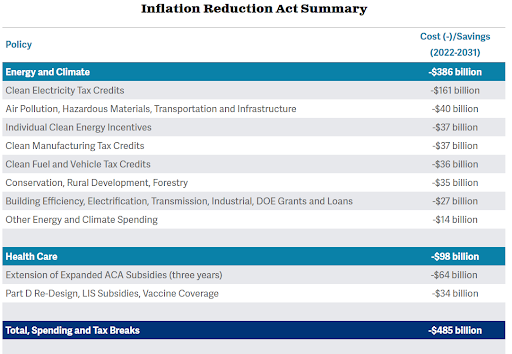
On Saturday, August 6, the Senate passed what is ironically titled the Inflation Reduction Act, which outlines $485 billion in new spending. After massive stimulus packages during the pandemic (2020-2021), Federal deficits increased by 38% and inflation is now around 9%. The third chart below from the CBO outlines the large components of the bill. Interestingly enough, both the CBO and the Penn Wharton Budget Model (nonpartisan research organization) question the impacts of the bill on inflation, making one question the authenticity of the bill’s title.
Please proceed to The Details.
“The reason I talk to myself is because I’m the only one whose answers I accept.”
–George Carlin
The Details
On Saturday, August 6, the Senate passed what is ironically titled the Inflation Reduction Act. The shock of the pandemic pushed legislators to pass unprecedented Federal stimulus spending in 2020 and 2021. These deficit spending bills increased U.S. Federal debt by 38%, now at $30.4 trillion. Additionally, they sparked massive inflation of over 9%. Now, Congress believes that spending an additional $485 billion will reduce inflation.

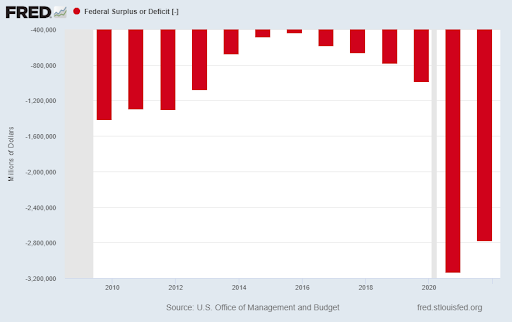
The House is expected to vote on the bill at the end of the week, with the President signing it shortly thereafter. When scoring the bill to determine its impact on the deficit and debt, its impacts are examined over the upcoming decade. This, in and of itself, is a bit ludicrous as Congress has a hard time estimating the effect of legislation within one year, nevertheless over a decade. One of the “wins” the Congressional Budget Office (CBO) proclaims for this legislation is it would decrease the Federal deficit by over $100 billion – over the next decade! It is important to understand that the estimates are being compared to the deficit of $2.8 trillion in 2021. This period contained unheard of amounts of Federal spending related to the pandemic. Comparing future estimates to this period is like comparing apples to oranges. Look at the chart below showing annual Federal deficits. Notice the massive increases in 2020 and 2021. Currently, the pandemic spending is over, so why would the CBO use 2021 to score the results of the Inflation Reduction Act?

The CBO produced the following summary of the Inflation Reduction Act.


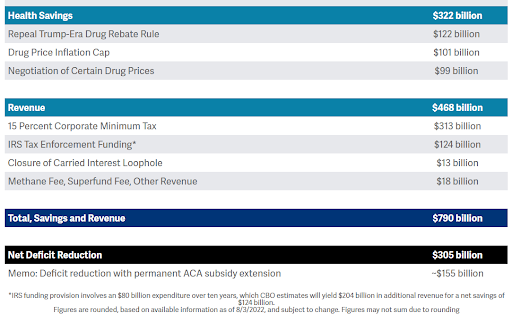
The closure of the carried interest loophole, included above, has been negotiated out by Senator Kyrsten Sinema. Of the $485 billion, $386 billion is earmarked for “clean energy initiatives.” How much of that $386 billion will generate revenues in excess of the amounts spent? Also, how will instituting a minimum corporate tax of 15% on corporations with at least $1 billion in income, reduce inflation? And, not itemized separately, corporate stock buybacks – beginning in 2023 – will be subject to a 1% excise tax. Could this produce a surge in buybacks through the end of this year?
In the footnote above, the IRS is expected to raise an additional $204 billion resulting from new “enforcement” efforts. Who will these new audits target, and how was that amount derived? The numbers outlined in the charts above are for the fiscal periods 2022-2031. Does anyone believe these numbers will come close to “actual” 10-year spending or revenue production?
According to the CBO, the bill will have a “negligible effect on inflation” of within 0.1% in either direction. And as written in an article in Forbes, “According to Penn Wharton Budget Model (PWBM), there’s low confidence the legislation will have any impact on inflation. PWBM is a nonpartisan, research-based organization at the University of Pennsylvania that creates economic analysis of public policy’s fiscal impact.”
If both the CBO and the PWBM are correct, how is it possible this bill was labeled the Inflation Reduction Act?
The S&P 500 Index closed at 4,145, up 0.4% for the week. The yield on the 10-year Treasury
Note rose to 2.84%. Oil prices dropped to $89 per barrel, and the national average price of gasoline according to AAA fell to $4.07 per gallon.
© 2022. This material was prepared by Bob Cremerius, CPA/PFS, of Prudent Financial, and does not necessarily represent the views of other presenting parties, nor their affiliates. This information should not be construed as investment, tax or legal advice. Past performance is not indicative of future performance. An index is unmanaged and one cannot invest directly in an index. Actual results, performance or achievements may differ materially from those expressed or implied. All information is believed to be from reliable sources; however we make no representation as to its completeness or accuracy.
Securities offered through First Heartland Capital, Inc., Member FINRA & SIPC. | Advisory Services offered through First Heartland Consultants, Inc. Prudent Financial is not affiliated with First Heartland Capital, Inc.

