Executive Summary
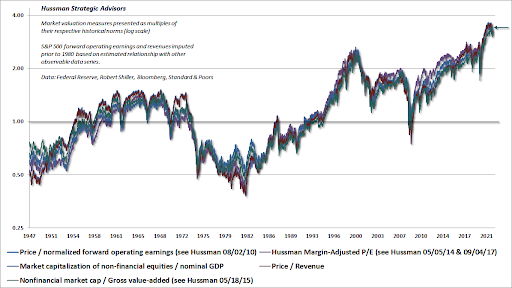
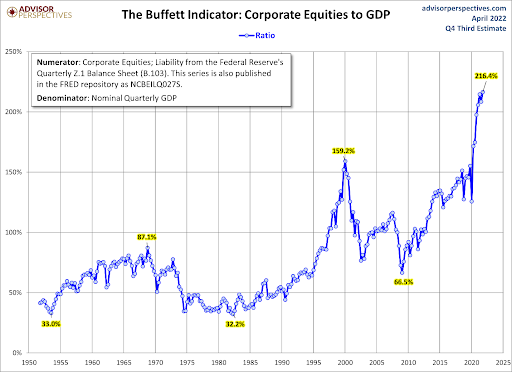
The Fed’s monetary policy for the last ten years has been characterized as “too loose for too long,” resulting in overvalued equity markets and inflation. Looking at the two graphs below, one can see the overvaluation as shown by various metrics. Statistically, the overvaluation is over three standard deviations above the mean – which only happens 0.3% of the time. However, now the Fed is reversing course and tightening monetary policy to fight inflation. First by raising interest rates and next by ending Quantitative Easing and starting Quantitative Tightening. While aggressively fighting inflation, Fed actions will put stock prices at risk. Continue to The Details for more on whether inflation or stock prices remain the focus of the Fed.
Please proceed to The Details.
“Constantly choosing the lesser of two evils is still choosing evil.”
–Jerry Garcia
The Details
So far, 2022 appears to be the year a new bear market begins. The reason for my conviction is the complete reversal by the Federal Reserve Bank (Fed) in current and proposed monetary policy. It is an unprecedented monetary policy (too loose for too long) which created the environment leading to the largest equity bubble in history. The two aspects of Fed policy have included zero-percent interest rates and massive Quantitative Easing (QE) – or purchasing Treasury securities thereby monetizing the Federal government’s massive deficits. Since changing their policy outlook, the Fed has only raised the short-term Federal Funds Rate (FFR) by a mere 0.25%. But the market has “priced-in” many more hikes as can be seen in the 2-year Treasury yield which has risen from 0.15% last June (2021) to 2.44% presently. This represents an incredible rate of change of 1,527%! The market has priced in close to 9 rate hikes for 2022.
Additionally, QE has ended, and QT (Quantitative Tightening) is about to start. Most pundits believe the Fed will begin in May reducing the size of their balance sheet by not replacing maturing bonds with additional purchases. The only reason the Fed seems interested in tightening monetary policy is in an attempt to rein in inflation which they willingly let run out of control. For years the Fed has denied the potential for high inflation spurred by excessively loose monetary policy. Now, inflation has taken-off and the FFR remains near zero percent. They are beginning to realize their choosing the equity markets over inflation was a huge mistake, and they appear willing to sacrifice their stock market bubble in order to try and tame inflation. The combination of expectations for rising rates and implementing QT on an expedited basis will eventually send chills through equity investors. And monetary tightening will likely push the economy into recession.
To make matters worse, valuations for major stock indices remain near all-time highs. This despite the year-to-date drop in prices. For instance, the S&P 500 is down 8% year-to-date, the Russell 2,000 small cap index is down 11%, and the tech-heavy Nasdaq index is down 15%. The fact that valuations remain near record highs is telling about how overvalued stocks have become.
To show graphically the level of overvaluation resulting from Fed actions, below are a couple graphs illustrating different methodologies. The first graph from economist John Hussman shows five different valuation methods all graphed together. All five of the calculations result in levels higher than the previous market valuation high witnessed during the Tech Bubble in 2000.

The following graph illustrates Warren Buffett’s favored valuation method, hence the title “The Buffett Indicator” comparing the market cap of equities to GDP. The long-term mean for this methodology is about 78%. The current reading is around 216% which is over three standard deviations from the mean. For those who love statistics, results in a normal distribution only fall outside of three standard deviations from the mean about 0.3% of the time or less. This statistic alone should provide support for the conviction of a new bear market since these levels occur so infrequently. And the fuel for prices pushed to these levels was overly loose monetary policy which is now doing an about-face!

The small correction experienced in the stock market this year could be the tip of the iceberg if the Fed continues its plan for monetary tightening in an attempt to get control of consumer prices which have, up until now, been sacrificed for the benefit of the stock market. Putting some simple math to the above charts reveals that a correction just to the mean could result in losses in the S&P 500 anywhere between 60-70%. For valuations to drop below the long-term mean, as seen in the 1940’s and 1950’s and again in the 1970’s and 1980’s (see graph above), would require an even greater drop in prices. Visually, the overvaluation levels in the graph above are stunning. Unfortunately, the reversion to the mean (or below) could be just as stunning.
It seems the only way to prevent a newly starting bear market would be a return to policies which not only fueled the bubble, but also run away inflation. At this time the Fed seems to have chosen to try and rein in inflation at the expense of the stock market bubble.
The S&P 500 Index closed at 4,393, down 2.1% for the week. The yield on the 10-year Treasury Note rose to 2.81%. Oil prices increased to $107 per barrel, and the national average price of gasoline according to AAA fell to $4.08 per gallon.
© 2022. This material was prepared by Bob Cremerius, CPA/PFS, of Prudent Financial, and does not necessarily represent the views of other presenting parties, nor their affiliates. This information should not be construed as investment, tax or legal advice. Past performance is not indicative of future performance. An index is unmanaged and one cannot invest directly in an index. Actual results, performance or achievements may differ materially from those expressed or implied. All information is believed to be from reliable sources; however we make no representation as to its completeness or accuracy.
Securities offered through First Heartland Capital, Inc., Member FINRA & SIPC. | Advisory Services offered through First Heartland Consultants, Inc. Prudent Financial is not affiliated with First Heartland Capital, Inc.

