Executive Summary
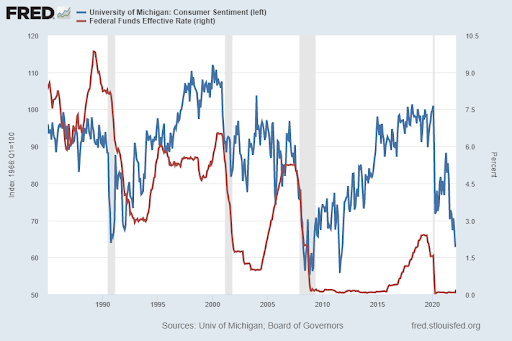
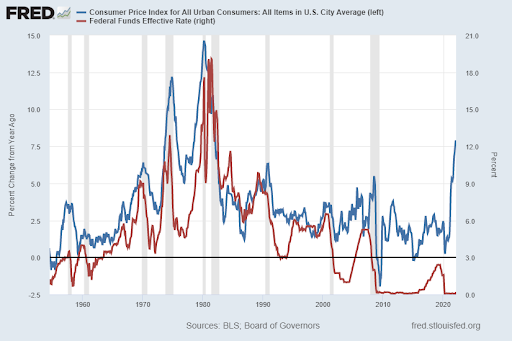
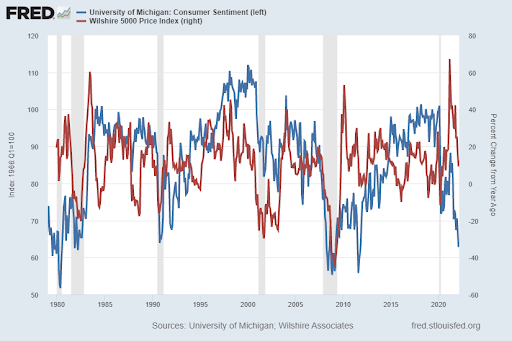
In March of this year the Fed began increasing short-term interest rates. Typically, they do not start rate tightening when consumer sentiment is plummeting (see first graph). At the same time, the Fed usually does not also hold rates so low when inflation is so high (see second graph). So now the Fed is trapped by needing to raise rates to fight inflation when economic growth and consumer sentiment are dropping. The first quarter 2022 annualized real GDP growth rate is estimated to drop over 6% from fourth quarter of 2021. The Covid19 stimulus provided a unique spike in real disposable income (3rd graph) which is now tumbling while inflation is rising. When consumer sentiment drops so rapidly and when bond yield curves invert, equity markets usually retreat as well. (See last two graphs) Will the Fed “solutions” be the same the next time? Please see The Details to learn more about their “solutions.”
Please proceed to The Details.
“Procrastination is the bad habit of putting off until the day after tomorrow what should have been done the day before yesterday.”
–Napoleon Hill
The Details
Notice in the graph below, since 1985, the Federal Reserve Bank (Fed) has not initiated a rate hiking campaign when consumer sentiment was this low and falling. The Federal Funds Rate (FFR) is in red in the graph and was recently raised to 0.25%. The market is currently pricing in over eight rate hikes this year. Typically, sentiment (blue line) is much higher and rising when a monetary rate tightening operation is begun.
At the same time, the Fed has never held the FFR so low when inflation was so high. The gap between the Consumer Price Index (CPI) and the FFR has never been this wide, examining data since 1954.
With consumer sentiment plunging while inflation rages, the economy is slowing at one of the fastest rates on record. The annualized real (inflation adjusted) growth rate of GDP in the fourth quarter of 2021 was about 7%. Hedgeye Risk Management is estimating first quarter 2022 annualized real economic growth at 0.73%. That would be an annualized plunge of over 6% in one quarter!
What could account for such a drastic swing? To put it simply, the end of free money. The arrival of Covid19 and subsequent business shutdowns terrified political leaders. To show the masses they were on top of this crisis, they passed numerous stimulus programs at a cost of unprecedented magnitude. Of course, the Federal government does not have a cushion in its annual budget, as can be seen by the annual trillion dollar plus deficits. Therefore, these borrowed funds were paid for by the Fed. But the Fed is not sitting on extra funds either, they merely “created” the money they needed to monetize the debt.
These exorbitant stimulus programs sent disposable income skyrocketing as never before witnessed. This is clearly illustrated on the graph below.
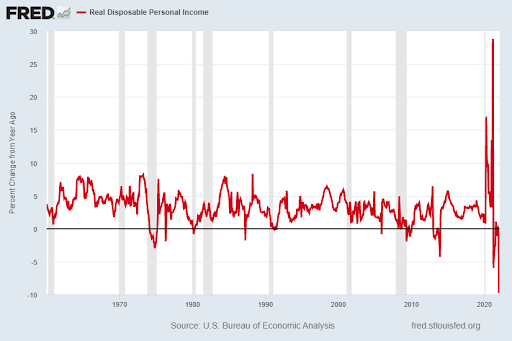
When these programs were initiated, I stated they would provide a temporary “sugar high” to the economy, after which growth would return to pre-stimulus levels. Presently, the well has run dry, and real disposable income is plummeting. In an economy driven by consumption, plunging disposable income is a warning sign. Hence, the rapid massive drop in expected economic growth for the first quarter of 2022, and the souring of consumer sentiment.
When consumer sentiment plunges, it is typically correlated, to some degree, by a drop in equity markets. In the chart below, the red line represents the annual price change in the Wilshire 5000 total market index. When sentiment (blue line) declines, notice the market is normally in close proximity. At current sentiment levels, the Wilshire 5000 index would need to drop over 35% just to pair up. And sentiment could continue to fall further.
Currently, the 10-year/2-year yield curve (discussed in last week’s newsletter) is inverted. This means the yield on a 10-year Treasury Note is lower than a 2-year Treasury. In all of the graphs shown in this missive, including the one below, the gray shaded areas represent recessions. Notice in the graph below the yield curve inverted prior to each recession illustrated. Additionally, even before the economy officially entered recession, the equity market, represented by the Wilshire 5000 index in red, usually began to fall rather precipitously.
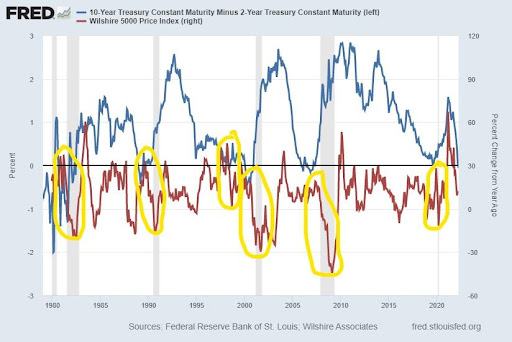
Many pundits, including myself, believe because of the speed with which the stimulus is wearing-off and inflation is rising, the equity market sell-off and probable inbound recession could appear faster than in prior periods.
Over the decades, the solutions to all financial crises have been the same. Stimulate through deficit spending and monetize the debt when necessary. These “solutions” do not solve any of the problems over the long-term. They allow for the pull-forward of consumption at the expense of an accumulating pile of non-productive debt. The results include slowing economic growth, more debt and inflation. First, our economy experienced asset inflation, and then inflation in the prices of goods and services. It appears the U.S. is heading back into another crisis in which I am sure the same “solutions” will be proposed. The Fed is already boxed-in. At this point, there is no easy way out. How much longer will the economy be able to sustain the same kick-the-can solutions?
The S&P 500 Index closed at 4,546, flat for the week. The yield on the 10-year Treasury Note fell to 2.38%. Oil prices decreased to $99 per barrel, and the national average price of gasoline according to AAA decreased to $4.19 per gallon.
© 2022. This material was prepared by Bob Cremerius, CPA/PFS, of Prudent Financial, and does not necessarily represent the views of other presenting parties, nor their affiliates. This information should not be construed as investment, tax or legal advice. Past performance is not indicative of future performance. An index is unmanaged and one cannot invest directly in an index. Actual results, performance or achievements may differ materially from those expressed or implied. All information is believed to be from reliable sources; however we make no representation as to its completeness or accuracy.
Securities offered through First Heartland Capital, Inc., Member FINRA & SIPC. | Advisory Services offered through First Heartland Consultants, Inc. Prudent Financial is not affiliated with First Heartland Capital, Inc.

