Executive Summary
Last week U.S. Federal debt surpassed $30 trillion! While notable, the more alarming fact is the rate of change since 2007 when it was under $10 trillion. Government programs designed to save the U.S. economy from the 2008 Financial Crisis and the 2020 Covid Pandemic resulted in near vertical growth (see first graph) in debt. The reality is the programs created temporary spikes in household disposable income (second graph) from these transfer payments and not long-term economic growth. Inflation is now causing a decline in purchasing power of wages, and consumer sentiment is declining (see 5th graph). The Atlanta Fed GDPNow model forecast first quarter 2022 GDP growth at 0.1%. Thus, the current economic situation may resemble a Potemkin Village – proceed to The Details for the full explanation.
Please proceed to The Details for an explanation of the relationships to watch moving forward.
“Behind every glorious façade there is always hidden something ugly.”
–Stanislaw Lem
The Details
Last week, U.S. Federal debt hit another major milestone as it surpassed $30 trillion. It is not the “level” of debt that is so troubling, but instead the rate of increase and level relative to gross domestic product (GDP). Notice in the graph below (blue line), Federal debt has tripled in size since the start of the Great Recession in December 2007. At under $10 trillion in 2007, much of the rapid growth in debt can be attributed to funding massive Federal deficits related largely to stimulus programs implemented in attempts at resuscitating the economy after both the Great Recession and the Covid19 pandemic. Already running large deficits pre-Great Recession and pre-pandemic, the Federal government needed to borrow funds to pay for the stimulus programs by selling Treasury securities. These securities were purchased by the Federal Reserve Bank (Fed). Of course, the Fed did not have this kind of extra money laying around, so they in turn “created” the funds out of thin air to purchase the Treasuries. Notice in the graph below (red line) that the Fed increased their assets by 10 times over the period from 2007 to present. This effectively sent the monetary base soaring.

Remember, the purpose of the stimulus programs was to “save” the economy. In reality, these actions merely provided a sugar-boost to the economy, which soon faded away leaving behind another huge pile of debt. The stimulus programs are easily identified in the graph below, just look at the short-term spikes in real disposable personal income.

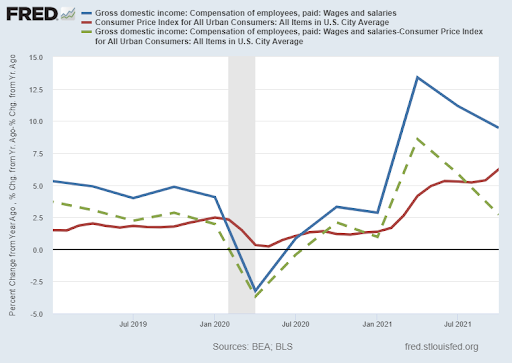
The surge in the monetary base combined with supply constraints have led to a significant rise in inflation. This, together with the fact that many former employees seemed to become content not working and collecting massive government benefits, led to wage pressures for employers. Notice in the graph below, the blue line represents gross salaries and wages. Gross wages spiked in the midst of massive government transfer payments. However, notice the green dashed line has fallen precipitously from its peak. This line represents inflation adjusted wages as the change in the Consumer Price Index (CPI) is subtracted from gross salaries and wages.

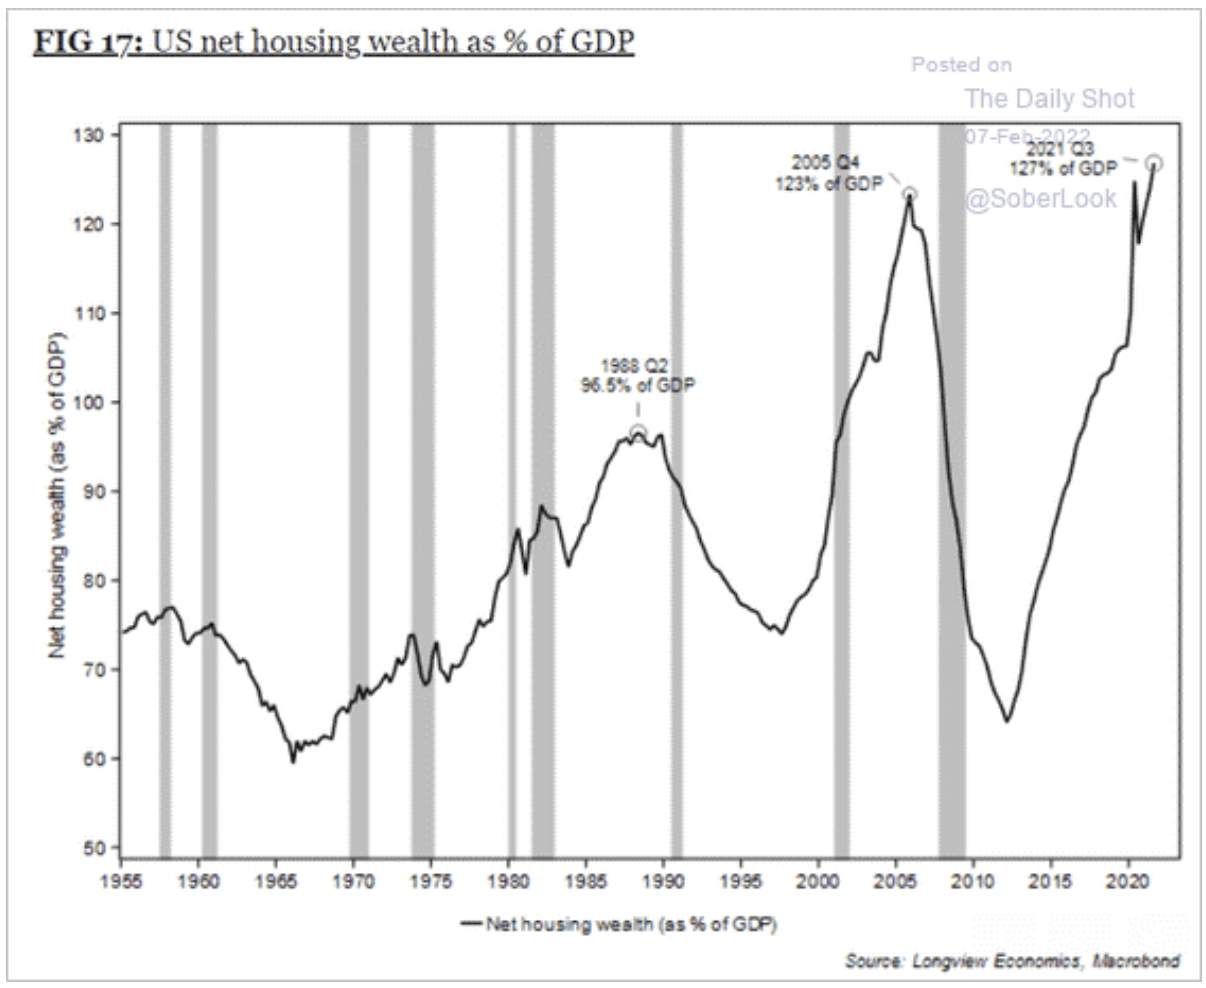
These excess disposable funds helped contribute to, not only a massive bubble in the stock market, but also a tremendous bubble in housing prices. See the chart below showing U.S. housing wealth-to-GDP at an all-time high even higher than the pre-Financial Crisis real estate bubble.

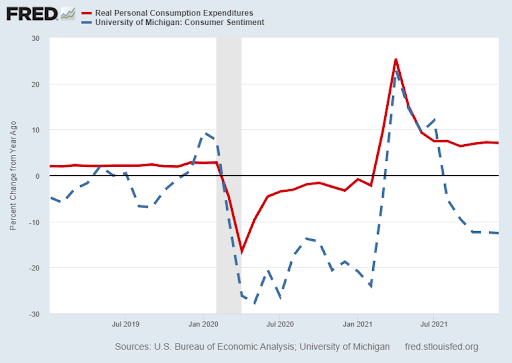
However, now that the Federal government’s spicket has been turned-off, consumer spending is falling. Consumer sentiment has plunged to lows typically only seen in or just after recessions. This level of sentiment will likely continue to put downward pressure on consumer spending. And consumer spending comprises almost 70% of GDP growth.

Following the temporary surge in GDP – after plummeting during the pandemic – recent decreases in consumer sentiment, declining real salaries and wages, and rising debt are again leading to weak economic growth. The Atlanta Fed’s GDPNow model is forecasting first quarter GDP growth to be 0.1%. This is close to a recessionary level.

The Fed is planning to stop purchasing bonds (printing money) over the next month. Additionally, the Fed will likely raise interest rates at least three times this year, beginning in February or March. These forces will probably put enormous pressure on stock prices which, although down from their peak, remain in record overvalued territory. If interest rates rise, combined with a slowing economy, I expect a significant amount of pressure will be put on the housing market. This market is currently impacted by low inventory levels spurred to a large degree by investor purchases of homes. A weakened economy with high commodity prices and rising interest rates could have a substantial negative impact on the housing market.
As these events transpire this year, the Potemkin Village created by unprecedented increases in the monetary base combined with massive stimulus programs which resulted in record Federal debt, will more than likely be revealed for what it is…a façade.
The S&P 500 Index closed at 4,501 up 1.5% for the week. The yield on the 10-year Treasury Note rose to 1.93%. Oil prices increased to $92 per barrel, and the national average price of gasoline according to AAA rose to $3.44 per gallon.
© 2022. This material was prepared by Bob Cremerius, CPA/PFS, of Prudent Financial, and does not necessarily represent the views of other presenting parties, nor their affiliates. This information should not be construed as investment, tax or legal advice. Past performance is not indicative of future performance. An index is unmanaged and one cannot invest directly in an index. Actual results, performance or achievements may differ materially from those expressed or implied. All information is believed to be from reliable sources; however we make no representation as to its completeness or accuracy.
Securities offered through First Heartland Capital, Inc., Member FINRA & SIPC. | Advisory Services offered through First Heartland Consultants, Inc. Prudent Financial is not affiliated with First Heartland Capital, Inc.

