Executive Summary
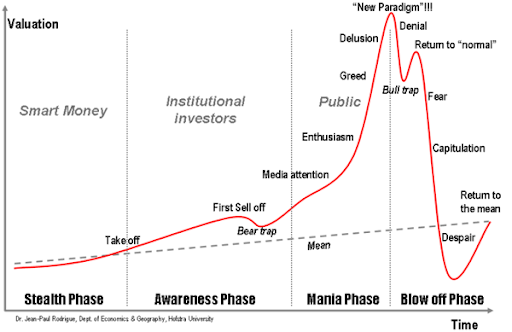
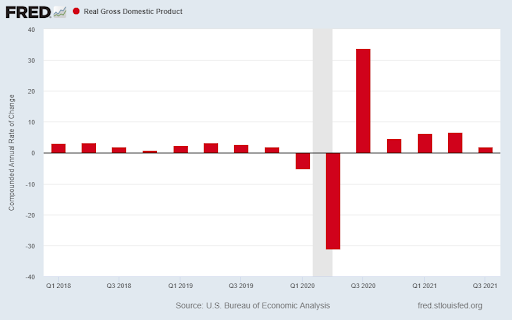
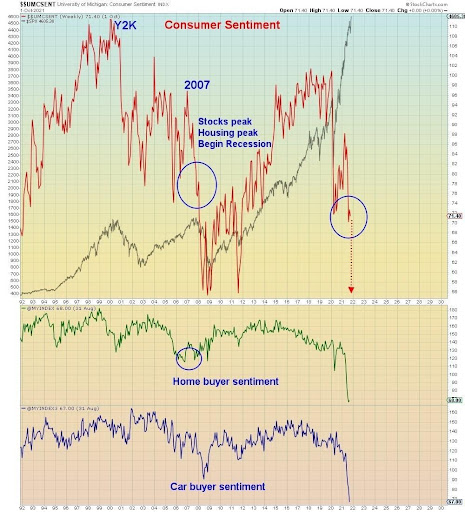
As the everything bubble remains in the “Blow off Phase” (first graph), the third quarter GDP number came in at only 2%. The negative COVID impact to GDP and the resulting stimulus positive impacts can be seen in the second graph below. Now the stimulus impacts are waning, and consumers are concerned with rising inflation. Companies are struggling with increasing input prices, negatively impacting profitability. This combined with drops in consumer sentiment (sixth graph) and potential Fed tapering, has historically not bode well for stocks.
Please proceed to The Details for a complete look.
“Courage consists not in blindly overlooking danger, but in seeing it, and conquering it.”
–Jean Paul
The Details
Investors continue to cheer the most epic stock market bubble in history. As the “Blow off Phase” persists, time could be running short as the obstacles are stacking up. In this newsletter, I will review some of the more serious issues investors seem to be overlooking.
Last week, the Bureau of Economic Analysis (BEA) reported the advance reading of third quarter real GDP growth (inflation-adjusted and annualized). The number came in at 2%, lower than the consensus of economists had forecasted. As a result, GDP remains below the pre-COVID19 trend. For the decade following the Great Recession, real GDP growth averaged close to 2%. When the pandemic hit, growth plummeted, that is until the largest injection of stimulus sent the economy soaring on one of the largest “sugar highs” ever experienced. However, as expected, the stimulus-induced economic surge only lasted a few quarters, before growth returned to near the pre-pandemic trend. Many economists now believe the advance reading will be revised lower, and weak growth will proceed in the fourth quarter and into next year. See the chart of annualized quarterly real GDP growth below.
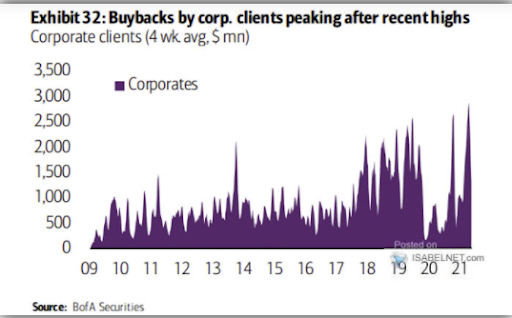
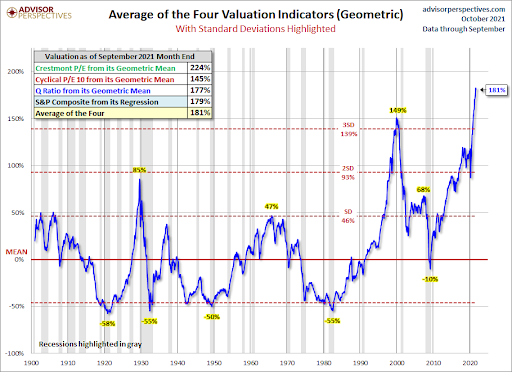
Overall economic growth is slowing as demand for goods and services falls. The extra “income” received by citizens has been spent, saved or used to reduce debt. With no more direct stimulus planned, consumer sentiment is plunging. The stock market, on the other hand, has skyrocketed with the dissemination of Federal stimulus and benefits. Between the extra funds funneled into the stock market by retail investors, combined with a new high in corporate stock buybacks, the stock market remains valued over three standard deviations above the long-term mean. This represents a statistical level only experienced 0.3% of the time and has never lasted in the long-run. See the two charts below.
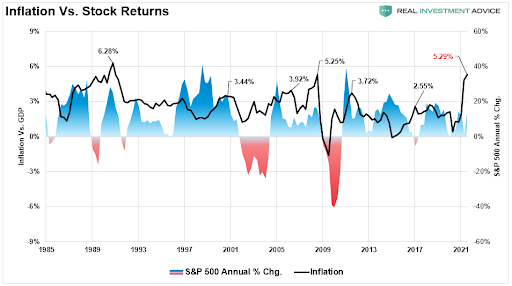
Consumers are concerned about the rising costs of goods and services. Many companies will see their profit margins squeezed as they attempt to keep prices from rising too much, even as their input costs explode. The consequence will be reduced earnings, creating an even larger gap between stock prices and earnings. Last week two of the largest capitalization companies, Amazon and Apple, reported disappointing earnings and outlooks. Historically, when inflation has surged, stock prices have taken a serious hit. See the graph below from Real Investment Advice.
The main factor propping up stock prices today is the psychological belief by investors that the Fed can keep the market rising ad infinitum. History proves this belief to be incorrect. In fact, the fall-off in sentiment is often correlated with significant stock market corrections, as seen in the graph below.
And after the FOMC (Federal Open Market Committee) meeting this week, the Fed will likely announce their schedule for tapering their bond purchases (QE). This is a form of monetary tightening or reducing liquidity injections. When combined with a weakening economy, rising inflation, reduced profit margins, and plunging consumer sentiment, the risk of a significant stock market correction is high.
Investors have been content to overlook these obstacles but would be wise to consider the potential consequences. The growing gap between stock prices and fundamentals is dangerously wide. History does not look favorably upon the end result of this type of set-up. As they say, history doesn’t repeat itself, but it often rhymes.
The S&P 500 Index closed at 4,605 up 1.3% for the week. The yield on the 10-year Treasury Note fell to 1.56%. Oil prices remained at $84 per barrel, and the national average price of gasoline according to AAA rose to $3.40 per gallon.
Thank you for taking the time to read this week’s report. If you frequent these posts, you know that I always like to take a moment of my day to be grateful for the life I live and to think of new ways to help those around me.
With that being said, I’d like to invite you to join me in supporting St. Jude’s Children’s Research Hospital.
I am a St. Jude Hero! I have chosen to run for a reason bigger than myself by fundraising for the kids and families at St. Jude. I am training to cross the finish line on race day and with your donation we can cross the fundraising finish line together because the money you donate helps find a cure for childhood cancer.
© 2021. This material was prepared by Bob Cremerius, CPA/PFS, of Prudent Financial, and does not necessarily represent the views of other presenting parties, nor their affiliates. This information should not be construed as investment, tax or legal advice. Past performance is not indicative of future performance. An index is unmanaged and one cannot invest directly in an index. Actual results, performance or achievements may differ materially from those expressed or implied. All information is believed to be from reliable sources; however we make no representation as to its completeness or accuracy.
Securities offered through First Heartland Capital, Inc., Member FINRA & SIPC. | Advisory Services offered through First Heartland Consultants, Inc. Prudent Financial is not affiliated with First Heartland Capital, Inc.

