Executive Summary
In this eye-opening look at the current stock market cycle, I compare the cycle to 1929 and 1999 as well as uncover one of the significant underlying factors fueling the bubble. In 1929 the S&P 500 P/E ratio peaked at 20, and in 1999 the Technology Bubble P/E ratio climbed to 34. Currently, the P/E ratio is over 40! Economist John Hussman’s graph (second one below) displays the stock market valuation method he has tested to be the most accurate. It goes back to 1947 and shows the height of the current cycle. The next two graphs show the extent of margin debt currently used to fuel the rise in stock prices. Many are saying that low interest rates justify these valuations in the stock markets. However, when growth is predicted to be low, there is not a mathematical justification for higher stock prices.
Please proceed to The Details.
“Some pretty intelligent people are now buying stocks… Unless we are to have a panic — which no one seriously believes, stocks have hit bottom.”
–R.W. McNeal, financial analyst in October 1929
The Details
Enlightened investors realize they are living through unprecedented times. Not only is there complete disregard for fundamentals, but investors are now guinea pigs in a grand experiment run by global central banks. Although the ultimate conclusion of such central bank actions might be presently unknown, an examination of the current stock market cycle compared to prior cycles is an eye-opener. Not since economist Irving Fisher’s proclamation that the stock market had reached a “permanent plateau” just days before the 1929 crash has there been such rapacity by investors.
In today’s missive I will provide an overview of the current state of the stock market and shed some light on what is contributing to its ascent despite what lies underneath. First a brief comparison to the two most notable stock market bubble peaks: 1929 and 1999. The S&P 500 price-to-earnings ratio (P/E), using trailing 12-month earnings, peaked in 1929 at 20, just prior to the Great Crash. At the most extreme level in the Technology Bubble in 1999, the P/E ratio climbed to an astounding 34. I would like to point out that the long-term average P/E for the S&P 500 is about 15. Currently, the P/E ratio is over 40! That is a whopping 2.7 times the long-term average. But that is not even the most egregious data-point.
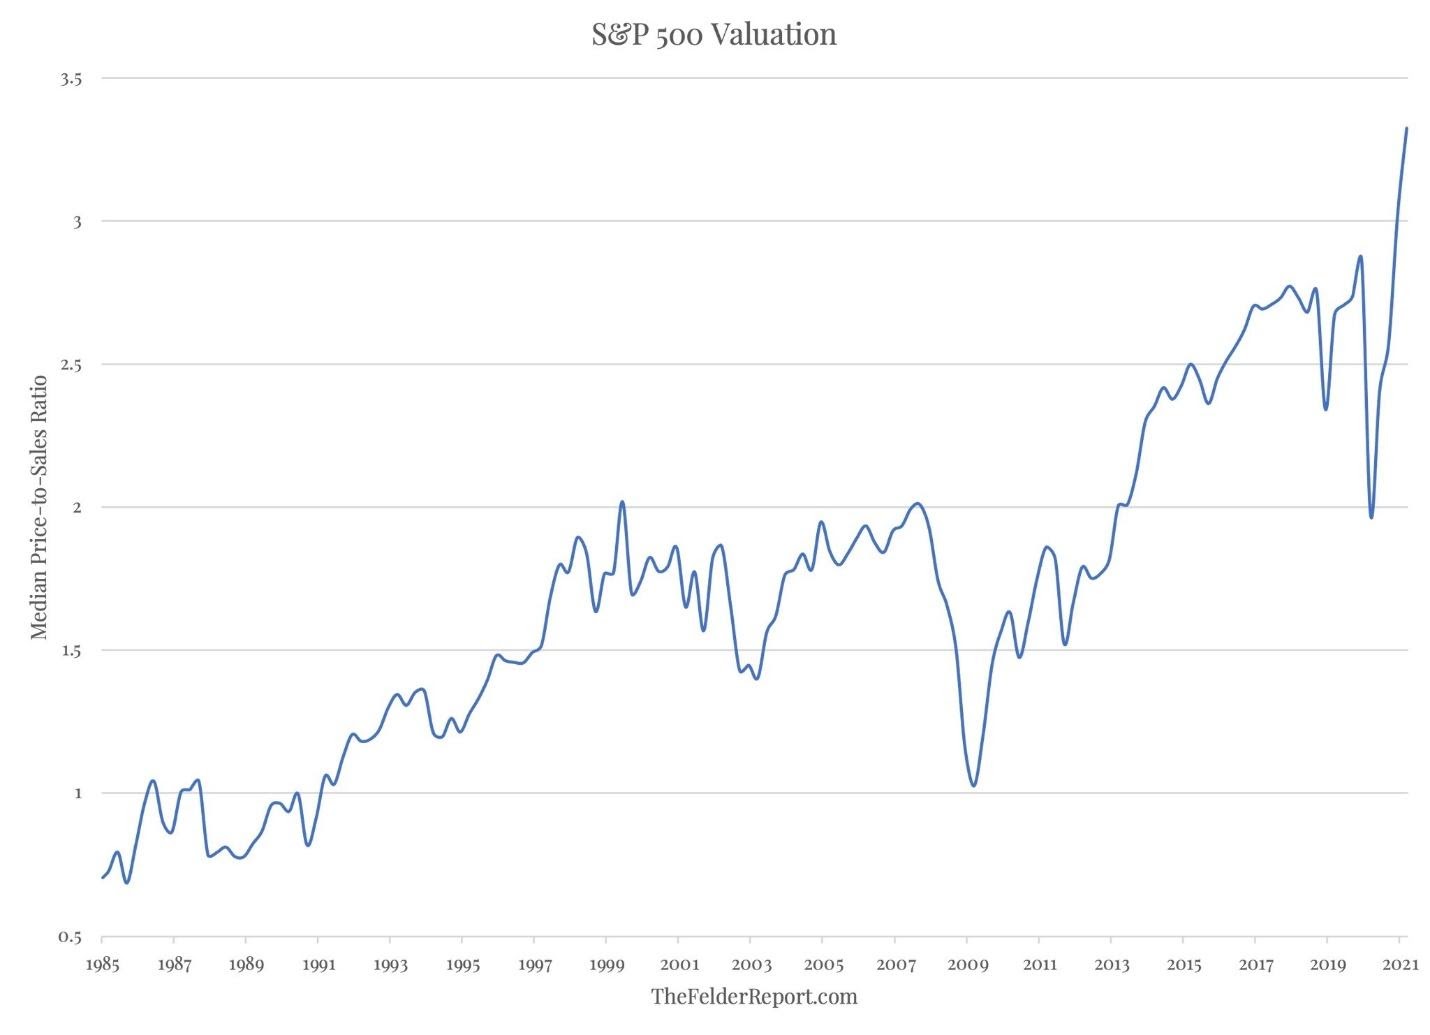
The Technology Bubble is known for being the most overvalued stock market cycle in history barring the present. One of the best metrics for determining valuation is the price-to-revenue (P/R) ratio. At the peak of the Technology Bubble the P/R ratio hit 2. Today, extended even above what is shown on the graph below, the median P/R ratio is 3.5 or 1.75 times higher than at the top of the greatest bubble in history.

Below is a valuation methodology determined by economist John Hussman to be the most correlated with subsequent returns. That is a fancy way of saying it is the most accurate measure of valuation he has discovered. As shown below, the current level exceeds every prior market cycle from 1946 to present. This level of valuation corresponds to a subsequent 12-year return of around negative 5% annually.

The extreme pricing relative to corporate revenues and earnings is being fueled by massive margin debt or borrowing money to purchase stocks. The graph below shows that margin debt far exceeds the Technology Bubble.

The graph and comment below are from John Hussman’s Market Comment.
“To say that margin debt to GDP is at the highest level in history is to say not only that stocks are heavily owned on margin, but that those stocks are also breathtakingly overvalued. That combination is particularly worrisome.”

Most financial analysts today attempt to justify stock valuations by pointing to low interest rates. The fallacy with this argument is if a low discount rate is used to calculate the present value of a future stream of income, then it implies a low rate of future growth. Here’s how John Hussman explains it:
“The truth is simple but uncomfortable. If interest rates are low and expected growth is held constant, higher valuations imply lower long-term returns. If interest rates are low because expected future growth is also low, higher valuations are not required. Long-term returns will be lower anyway. A valuation premium just makes future returns even worse.
Saying that extremely low interest rates ‘justify’ extremely high stock valuations is identical to saying that extremely low future returns on bonds ‘justify’ extremely low future returns on stocks. I don’t really think that’s something Wall Street cares to clarify when it tells investors that stock market valuations are ‘justified.’”
Hussman’s calculations of valuation indicate the S&P 500 is priced about “3.6 times their historical norms.” This number is not a random assumption pulled out of thin air. It is based upon much research of historical valuations and subsequent returns. To bring a price back to historical norms that is 3.6 times above that norm would take a drop of 72%. That is not to say prices will plunge 72% this week or even this year. It does indicate that conditions are ripe for the possibility of a trap door opening up at any time. Hussman included the following comments from John Kenneth Galbraith on the 1929 collapse in his Market Comment:
“How little, it will perhaps be agreed, was either original or otherwise remarkable about this history. Prices driven up on the expectation that they would go up, the expectation realized by the resulting purchases. Then the inevitable reversal of these expectations because of some seemingly damaging event or development or perhaps merely because the supply of intellectually vulnerable buyers was exhausted. Whatever the reason (and it is unimportant), the absolute certainty is that this world ends not with a whimper but with a bang. And so on to the moment of mass disillusion and the crash. This last, it will now be sufficiently evident, never comes gently. It is always accompanied by a desperate and largely unsuccessful effort to get out.”
The S&P 500 Index closed at 3,943, up 2.6% for the week. The yield on the 10-year Treasury Note rose to 1.64%. Oil prices remained at $66 per barrel, and the national average price of gasoline according to AAA rose to $2.86 per gallon.
© 2021. This material was prepared by Bob Cremerius, CPA/PFS, of Prudent Financial, and does not necessarily represent the views of other presenting parties, nor their affiliates. This information should not be construed as investment, tax or legal advice. Past performance is not indicative of future performance. An index is unmanaged and one cannot invest directly in an index. Actual results, performance or achievements may differ materially from those expressed or implied. All information is believed to be from reliable sources; however we make no representation as to its completeness or accuracy.
Securities offered through First Heartland Capital, Inc., Member FINRA & SIPC. | Advisory Services offered through First Heartland Consultants, Inc. Prudent Financial is not affiliated with First Heartland Capital, Inc.

