Executive Summary
Government’s initial response to the onset of COVID-19 was to force businesses to avoid person-to-person contact. This action resulted in businesses laying-off millions of workers. For some perspective, before the arrival of COVID-19, the highest number of initial weekly unemployment claims was 695,000 in 1982. During the Financial Crisis in March 2009, the highest weekly claims came in at 665,000. As illustrated in the first chart below, initial jobless claims have exceeded 1 million for almost 22 consecutive weeks. According to the Household Survey in the Bureau of Labor Statistics’ The Employment Situation – July report, there were 159,870,000 people in the labor force. If 28,059,349 people were drawing some form of unemployment compensation on August 1, that represents 17.5% of the labor force – much higher than the “official” unemployment rate of 10.2%.
Please proceed to The Details for an understanding of how the lack of a replacement for the Paycheck Protection Program funds does not bode well for the employment picture.
“The escalator doesn’t work, and you’d think they’d still be used as stairs, but in this economic depression, even the stairs are unemployed.”
–Jarod Kintz
The Details
Government’s initial response to the onset of COVID-19 was to force businesses to avoid person-to-person contact. This action resulted in businesses laying-off millions of workers. In an attempt to minimize the impact of forced layoffs, the Government passed the Paycheck Protection Program (PPP) which provided funds in the form of a forgivable loan to qualifying businesses. The main requirement was the bulk of the funds had to be spent on payroll or payroll related costs, with the remainder spent on certain other overhead expenses.
Prior to the implementation of the PPP, layoffs and unemployment claim filings surged. Many were re-hired once PPP funds had arrived, even if the employees weren’t actually working. At the time, the prevailing consensus was the pandemic would last for a few weeks. And by the time the PPP funds were depleted, it would be business as usual. Unfortunately, the virus had other plans. To the disappointment of Government leaders and the frustration and anger of business owners, the initial lockdowns did not produce the desired outcome. The virus continued spreading. So, what is the employment picture looking like now?
For some perspective, before the arrival of COVID-19, the highest number of initial weekly unemployment claims was 695,000 in 1982. During the Financial Crisis, the highest weekly claims came in at 665,000 in March 2009. As illustrated in the chart below, initial jobless claims have exceeded 1 million, with two weeks exceeding 6 million per week, for almost 22 consecutive weeks. The only exception was two weeks ago, the claims totaled “only” 971,000, still far above the pre-pandemic record.
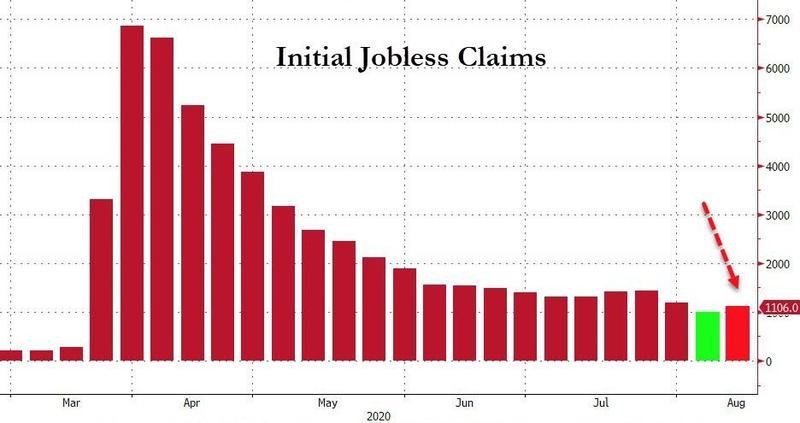
Even with PPP money provided to many businesses, first-time claims exceeded the pre-COVID-19 highest weekly claims number every week for over 5 months and counting. This indicates that the jobs picture is worse than originally anticipated. Many of the previous “temporary” layoffs have become permanent. The chart below from the Department of Labor (DOL) shows the total number of individuals drawing unemployment benefits under all programs as of August 1 exceeded 28 million.

And the graph below illustrates the severity of the total number of individuals receiving unemployment benefits.
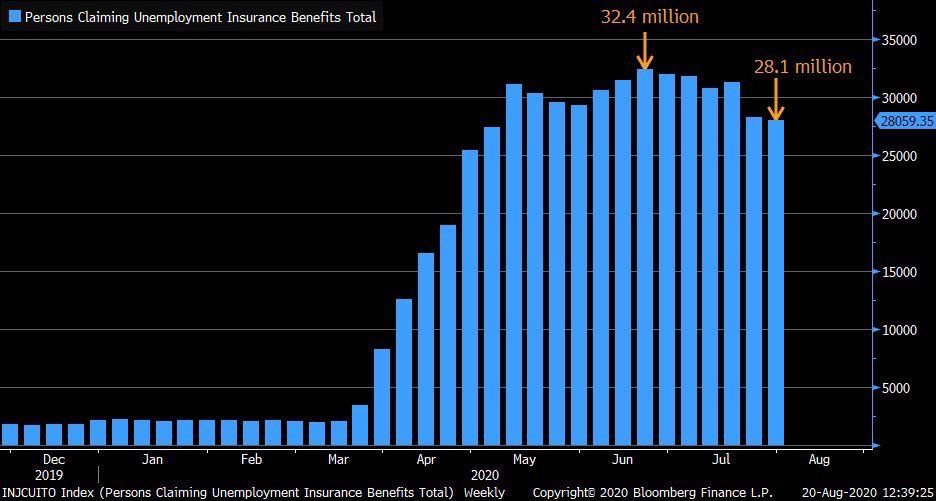
According to the Household Survey in the Bureau of Labor Statistics’ The Employment Situation – July report, there were 159,870,000 people in the labor force. If 28,059,349 people were drawing some form of unemployment compensation on August 1, that represents 17.5% of the labor force. This is much higher than the “official” unemployment rate of 10.2%.
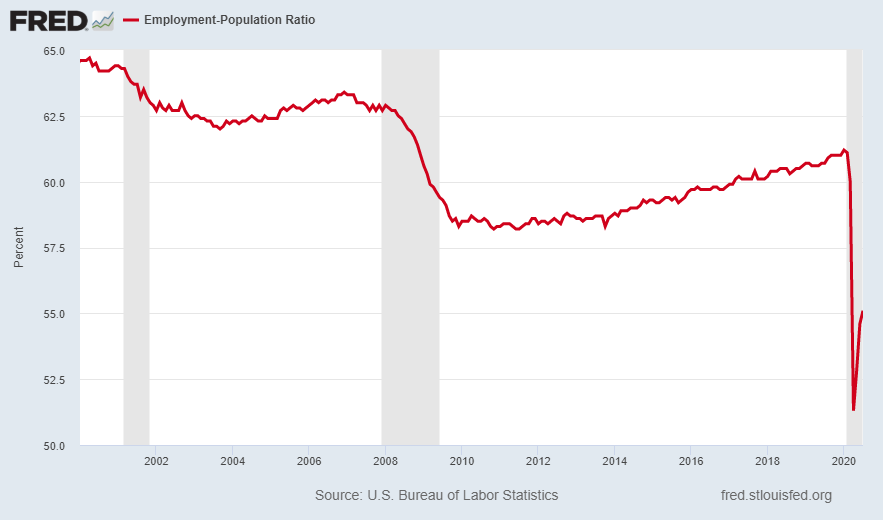
The graph below depicts the stark drop in the Employment-to-Population ratio as the recession officially began in February 2020. Notice the rebound off of the bottom remains far below prior employment levels.
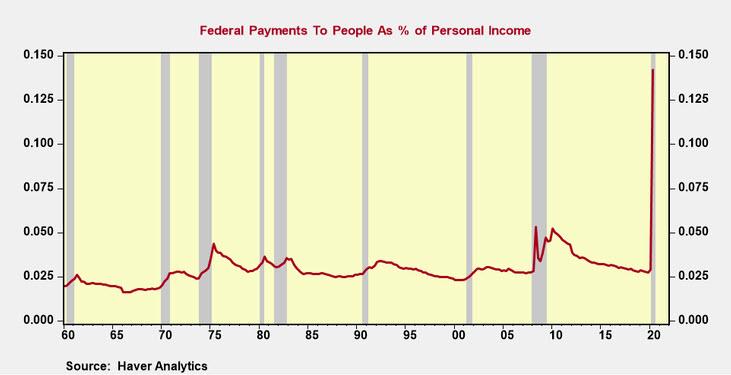
Presently, there are no Bills in Congress, that have garnered enough support to pass, which would provide additional stimulus for small businesses. Therefore, with most of the previous PPP money spent, it is likely that unemployment will rise. If unemployment increases, and no additional stimulus funds are provided, then consumer incomes, and therefore spending, will be reduced. Up until now, household disposable income was juiced by massive stimulus programs, including a $600 per week supplement to unemployment benefits. This extra income outweighed the loss of employment earnings. The two graphs below show the massive infusion of Federal benefits, and the replacement of employment compensation with Federal aid.
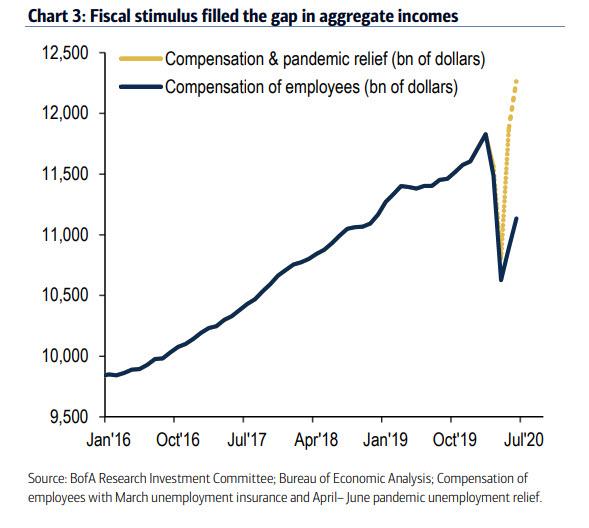
Even though the President, via Executive Order, has extended the supplemental unemployment amount to $400 per week, versus $600 previously, the lack of funds available to small businesses diminishes the chances many of these jobs will return. Also, most regular plus extended unemployment benefits end after about 39 weeks. Therefore, if someone began drawing unemployment benefits in February 2020, those benefits will likely stop by November.
The number of newly unemployed workers is growing each week as almost 1 million people or more continue to file for first-time unemployment benefits. The lack of a replacement for PPP funds combined with continued pandemic-weakened economic activity does not bode well for those on temporary layoff or working for businesses struggling to stay alive. The Government is close to $27 trillion in debt and total all debt (private and public) to GDP is skyrocketing to near 310%. How much more debt can the Government incur in order to save businesses and jobs?
Unfortunately, the Government is in a catch-22. They need to borrow more money to provide further stimulus, but at some point, the additional debt will weigh on the confidence in the dollar. If confidence in the dollar falls, then inflation will likely arrive. The employment picture is currently littered with obstacles. How this plays out depends upon what the Federal Government does next.
The S&P 500 Index closed at 3,397 up 0.7% for the week. The yield on the 10-year Treasury Note fell to 0.64%. Oil prices remained at $42 per barrel, and the national average price of gasoline according to AAA increased to $2.19 per gallon.
© 2020. This material was prepared by Bob Cremerius, CPA/PFS, of Prudent Financial, and does not necessarily represent the views of other presenting parties, nor their affiliates. This information should not be construed as investment, tax or legal advice. Past performance is not indicative of future performance. An index is unmanaged and one cannot invest directly in an index. Actual results, performance or achievements may differ materially from those expressed or implied. All information is believed to be from reliable sources; however we make no representation as to its completeness or accuracy.
Securities offered through First Heartland Capital, Inc., Member FINRA & SIPC. | Advisory Services offered through First Heartland Consultants, Inc. Prudent Financial is not affiliated with First Heartland Capital, Inc.

