Executive Summary
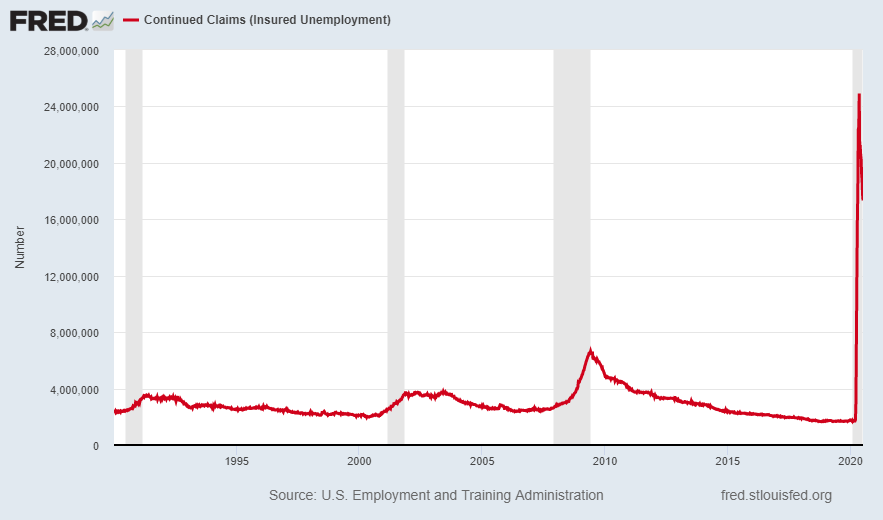
The National Bureau of Economic Research (NBER) declared a recession officially began in February of this year. Since March, over 50 million people have filed first time unemployment claims. Additionally, real annualized economic growth fell 5% in the first quarter and is expected to fall almost 35% in the second quarter. With all of that said, when one looks around, people are not acting like the U.S. is in a recession. In the second chart below, one can see that real disposable income actually grew. One may ask how? The Federal Government has provided massive “stimulus” including “one-time” payments for individuals, an additional $600 per week was added to regular unemployment benefits, and businesses and non-profits received large sums under the Paycheck Protection Program. Delinquencies on real estate loans are rising and bankruptcies are fast approaching the Financial Crisis levels. Yes, it is the Federal Government papering over the feelings of recession! Can the Federal Government continue perpetual stimulus to ward off the pain of recession? I doubt it.
Please proceed to The Details which is full of graphs and charts to help visualize the current situation.
“If printing money helped the economy, then counterfeiting should be legal.”
–Brian Wesbury
The Details
The National Bureau of Economic Research (NBER), the group responsible for dating recessions, declared a recession officially began in February of this year. Since March, over 50 million people have filed first time unemployment claims, a number more likely seen in a depression versus a recession. Additionally, real annualized economic growth fell 5% in the first quarter and, according to the Atlanta Fed GDPNow model, is expected to fall almost 35% in the second quarter. The New York Fed’s Nowcast model estimates a jump of 13% in the third quarter. Even with the bounce in the third quarter, a flat fourth quarter would leave real GDP down about 7% for the year. With all of that said, when one looks around, people are not acting like the U.S. is in a recession. People are still buying homes, home repairs have increased pushing the cost of lumber higher, and many still want their $5 cup of coffee. So, what gives?
Looking at the record numbers of continuing unemployment claims in the graph below, one might believe we are in the Greater Depression.
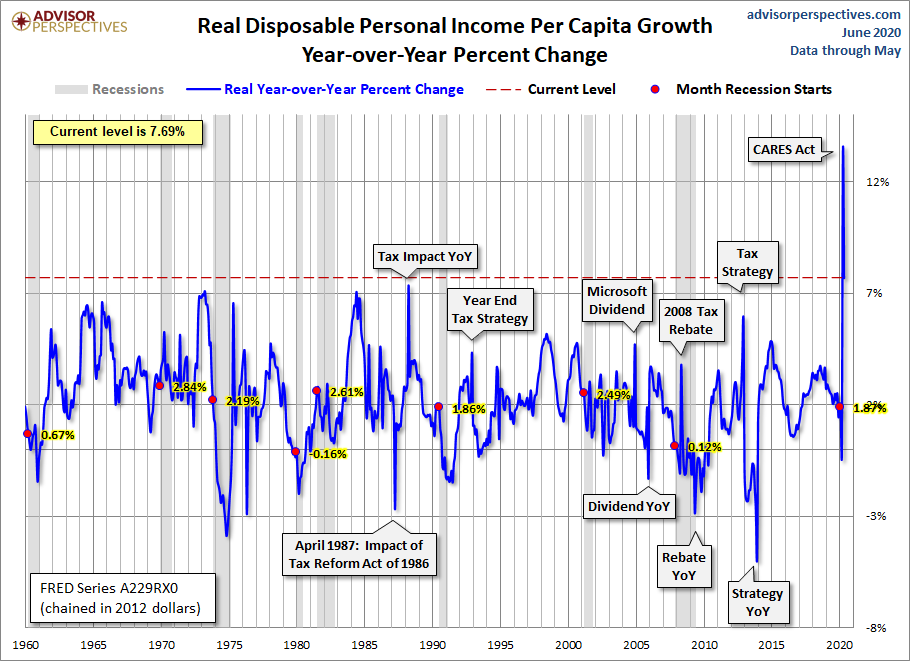
The chart of real disposable income per capita below is diametrically opposed to the chart of unemployment. How can that be? Real disposable income grew at a higher rate than any time since 1960… in a recession with a record number of unemployed workers? Yes, and Uncle Sam is to thank.
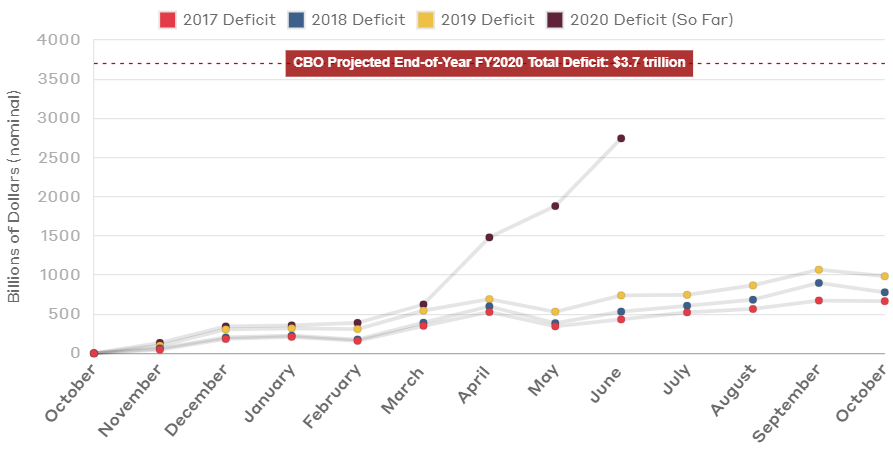
It is a good thing the Federal Government has been saving money and paying down debt over the past decade of “recovery.” Oh wait, that never happened. So, where is this money coming from? The Federal Reserve Bank (Fed) is printing money to fund government deficits. The U.S. has been running massive deficits for decades. These deficits were growing in size even before the pandemic hit, and the Federal Government decided to go on a spending spree. Notice the surge in the 2020 deficit in the chart below. The deficit for the month of June was $864 billion, or 88% of the deficit for the entire fiscal year of 2019.
To briefly recap, the Federal Government has provided “stimulus” payments of $1,200 for individuals earning up to $75,000 and $2,400 for couples filing jointly with income up to $150,000. Then, an additional $600 per week was added to regular unemployment benefits providing an income often higher than that earned while working. For businesses and non-profits, the Paycheck Protection Program (PPP) provided forgivable loans designed to cover payroll costs to keep employees at work and some other overhead expenses.
The sum of these benefits has been so large that disposable income soared as can be seen in the previous chart. However, did these programs “solve” the problems or merely delay the inevitable? Adding to the dilemma, the Fed lowered interest rates encouraging borrowing. Some debt forbearance programs have been put in place, but these could cause even larger problems down the road as the debt isn’t forgiven, rather merely delayed.
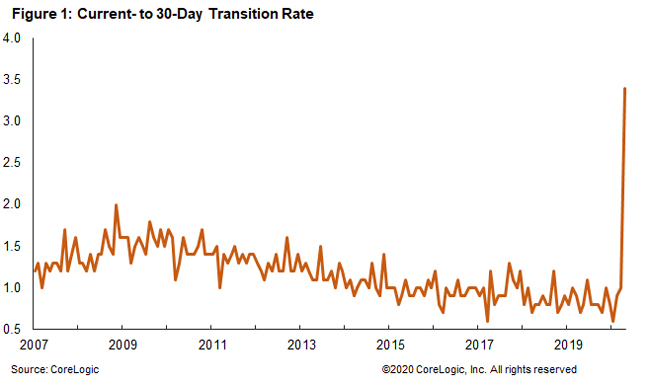
The graph below shows the incredible jump in mortgages transitioning from current to 30-days past due.
And the following shows delinquency rates for other types of properties.
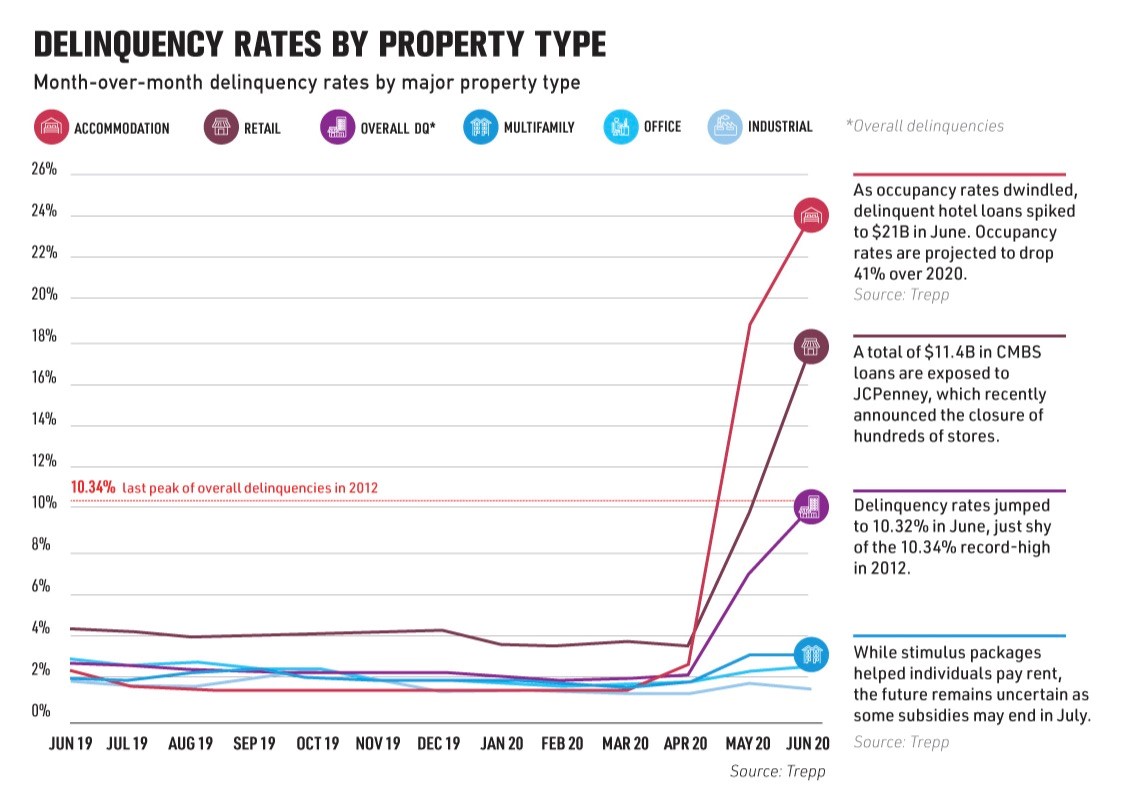
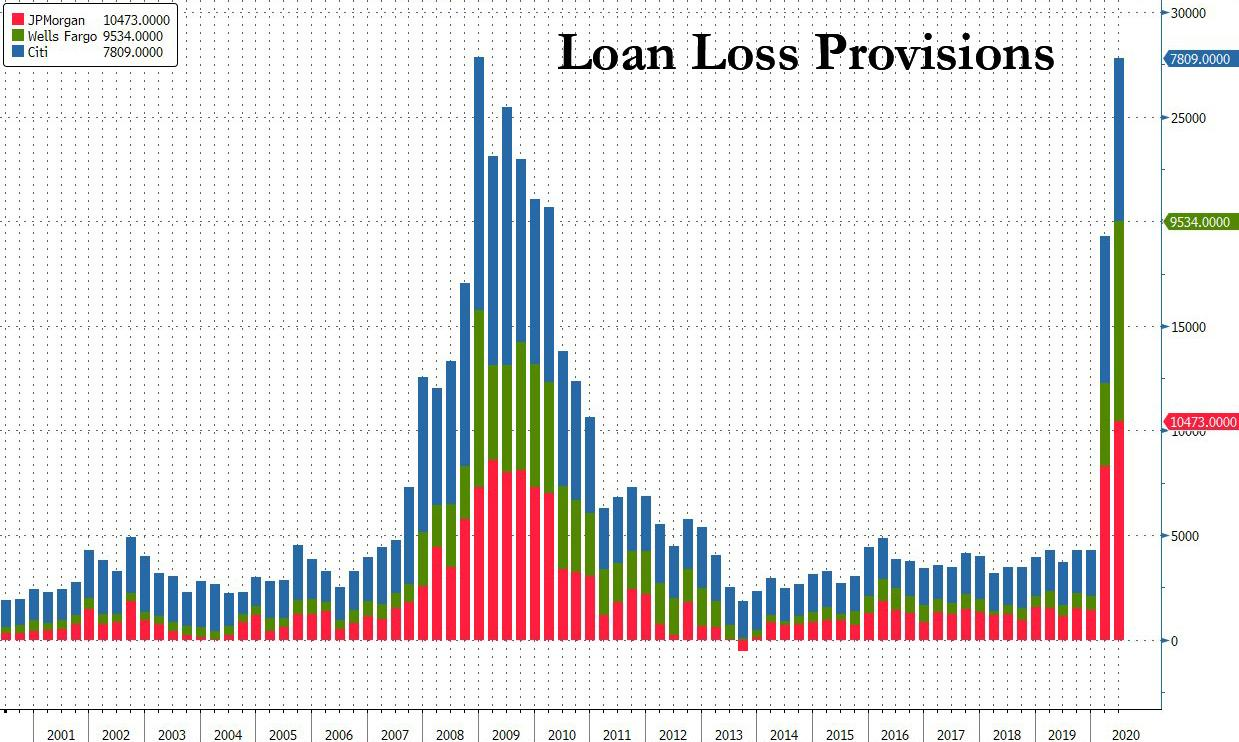
The large banks drastically increased their loan loss provisions to levels not seen since the Financial Crisis, as they anticipate many future defaults.
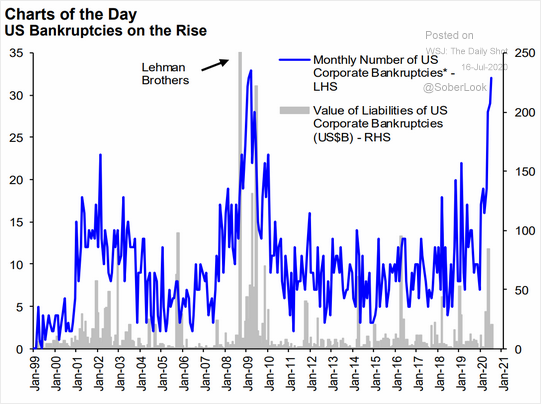
And, despite the tremendous amount of funds funneled to businesses through the PPP, the number of bankruptcies is already approaching the Financial Crisis peak.
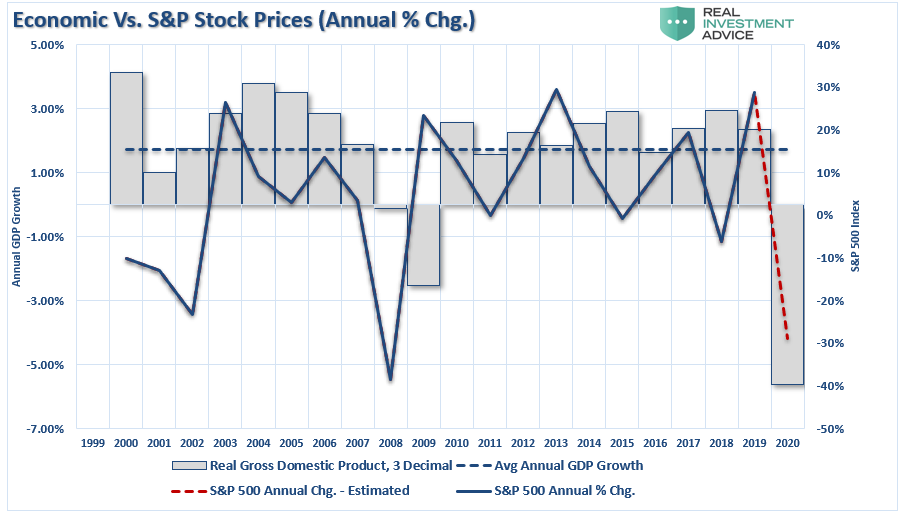
And, despite near record numbers of unemployed, soaring loan loss provisions and bankruptcies, the stock market has continued to bounce from its end of March low. This has been led by technology companies, as the market is now in the largest bubble ever as the economy crumbles. Notice in the graph below what the economy is foretelling for the stock market.
With debt growing substantially faster than the economy, the pandemic continuing, and corporate earnings plunging, can the Federal Government institute any programs to reverse the course? Stimulus funds have been spent, PPP funds are likely almost depleted, and the extra unemployment benefit is due to expire this week. Congress is scrambling in an election year to try to “save” the economy with further “stimulus” plans. The House has another $3 trillion proposal while the Senate’s is closer to $1 trillion. What are a couple trillion among friends?
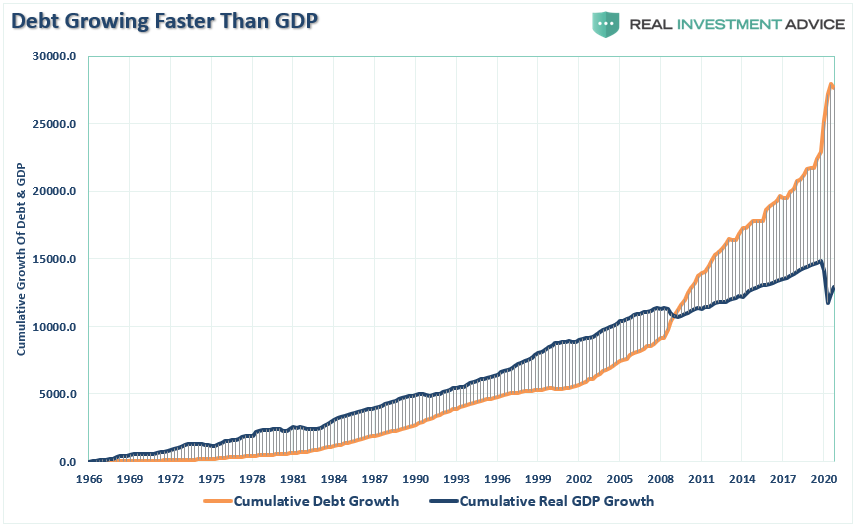
Any programs passed will merely delay the ultimate future reckoning. As I have stated ad nauseum, the problem is too much debt, and the proposals all involve more debt as the solution. Once the stimulus, whether for individuals or businesses, runs out, the economy will plunge. We seem to have reached the point where perpetual stimulus is required to keep the train moving.
It might not feel like a recession to some, but once the stimulus stops flowing, reality will arrive. Without further PPP money many employees will be let go permanently, and without the addition $600 per week, the pain will begin. Can the Federal Government continue perpetual stimulus to ward off the pain of recession? I doubt it.
The S&P 500 Index closed at 3,185 up 1.2% for the week. The yield on the 10-year Treasury Note remained at 0.63%. Oil prices remained at $41 per barrel, and the national average price of gasoline according to AAA remained at $2.20 per gallon.
© 2020. This material was prepared by Bob Cremerius, CPA/PFS, of Prudent Financial, and does not necessarily represent the views of other presenting parties, nor their affiliates. This information should not be construed as investment, tax or legal advice. Past performance is not indicative of future performance. An index is unmanaged and one cannot invest directly in an index. Actual results, performance or achievements may differ materially from those expressed or implied. All information is believed to be from reliable sources; however we make no representation as to its completeness or accuracy.
Securities offered through First Heartland Capital, Inc., Member FINRA & SIPC. | Advisory Services offered through First Heartland Consultants, Inc. Prudent Financial is not affiliated with First Heartland Capital, Inc.

