Executive Summary
Some investors might not realize that the S&P 500 is a market capitalization weighted index. Although there are 500 companies in the S&P 500 Index, almost 22% of the performance is determined by only five companies or two percent of the total. Investing legend Bob Farrell included the following in his 10 Rules for Investing: “Rule #7: Markets are strongest when they are broad and weakest when they narrow to a handful of blue-chip names.” As stock prices soar while earnings plummet, valuations reach the stratosphere. Amazon’s trailing 12-month P/E is 148. Those who remember the Tech Bubble, which peaked in 2000 and subsequently crashed from 2000-2002 with the tech laden Nasdaq 100 falling over 80%, have seen these types of valuations before. Currently, the market reeks of bad breadth.
Please proceed to The Details for important graphs and an update on the “too big to fail” bank earnings announcements.
“Good manners and bad breath will get you nowhere.”
–Elvis Costello
The Details
Some investors might not realize that the S&P 500 is a market capitalization weighted index. As such, the largest companies comprise a greater portion of the index. This is calculated by dividing the market capitalization of a stock (total shares outstanding times the share price) by the total market capitalization of all of the stocks in the index. Currently, the top five holdings and percent of the index per Yahoo Finance are:
Microsoft 6.00%
Apple 5.78%
Amazon 4.49%
Alphabet (A & C) 3.26%
Facebook 2.12%
Total 21.65%
Although there are 500 companies in the S&P 500 Index, almost 22% of the performance is determined by only five companies or two percent of the total. According to Investopedia, “Market Breadth refers to how many stocks are participating in a given move in an index or on a stock exchange.” A strong market is one which is represented by a large contingent of stocks. Investing legend Bob Farrell included the following in his 10 Rules for Investing:
“Rule #7: Markets are strongest when they are broad and weakest when they narrow to a handful of blue-chip names.”
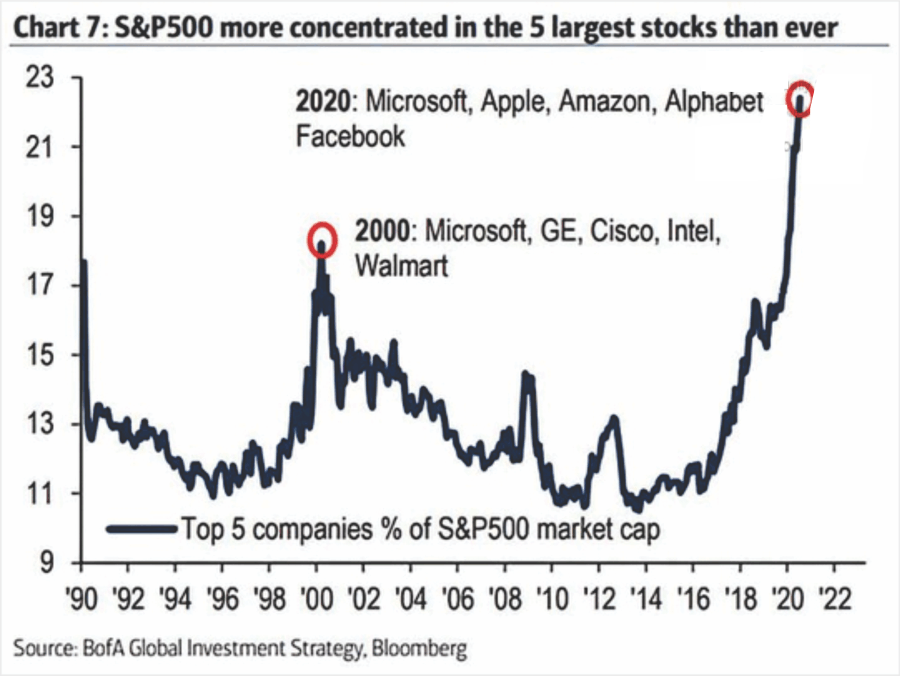
The chart below illustrates graphically this weighting of the top holdings. Notice at the top of the Technology Bubble in 2000, the over-weighted companies were Microsoft, GE, Cisco, Intel and Walmart. The market is more concentrated now than it was at the 2000 peak.
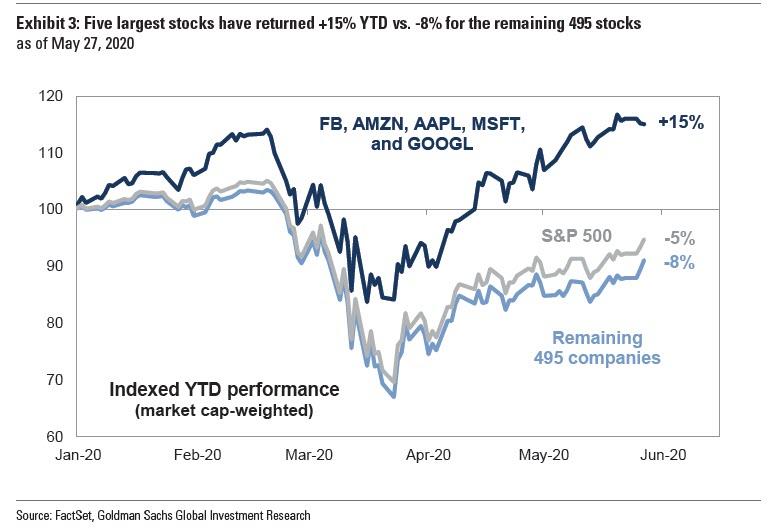
The chart below highlights that as of May 27th of this year, when the S&P 500 was down about 5%, the top five holdings were up 15%. Excluding the top five companies, the index was down 8%.
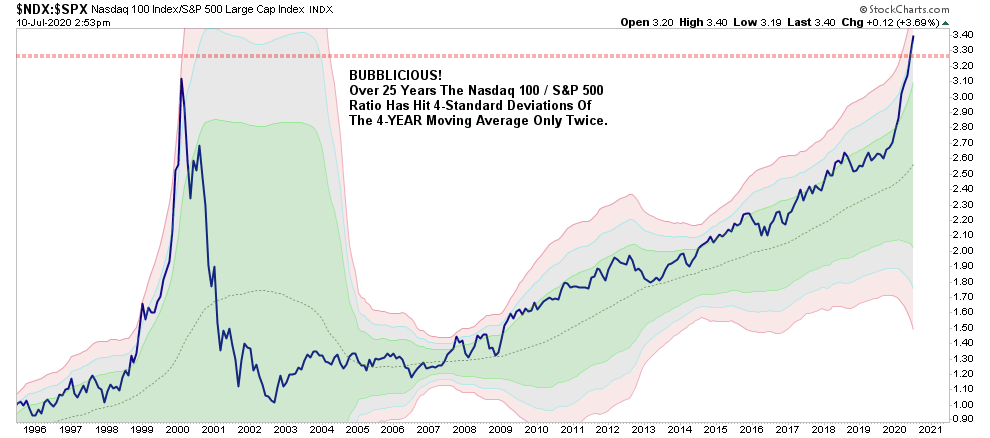
The run-up in these predominantly technology companies is reminiscent of 2000. In fact, the Nasdaq 100-to-S&P 500 ratio is higher today than in 2000, as shown in the graph below.
As stock prices soar while earnings plummet, valuations reach the stratosphere. According to the S&P Dow Jones Indices website, the current estimate for second quarter net earnings of the S&P 500 compared to the same quarter last year is a drop of 45%. The estimate for full-year 2020 is down 35% year-over-year. Let’s look at some price-to-earnings ratios (P/E) to see how overvalued stocks have become. The trailing 12-month P/E of the S&P 500 Index is 27.1. Outside of the Tech Bubble and the depths of the Financial Crisis when earnings had fallen through the floor, this is the highest P/E in the history of the market. The Shiller P/E (10-year average inflation adjusted earnings) is 29.4, which is near its all-time high outside of the Tech Bubble Peak.
Looking at one of the famous five largest companies in the S&P 500 Index, Amazon’s trailing 12-month P/E is 148. Those who remember the Tech Bubble, which peaked in 2000 and subsequently crashed from 2000-2002 with the tech laden Nasdaq 100 falling over 80%, have seen these types of valuations before. The ultimate outcome of these valuations has always been the same, a deep bear market.
In February of this year, COVID-19 became the pin which pricked the decade-long bubble created subsequent to the Financial Crisis. A decade of unprecedented money creation and artificially low short-term interest rates fed the bubble leading to irrational valuations at year-end 2019. The swift market plunge through the end of March of this year was interrupted when the Fed again reduced interest rates to zero percent and created about $3 trillion. Financial pundits encouraged the market optimism by falsely claiming a quick “V” shaped economic recovery was around the corner. I have written over the past few weeks why this conclusion is almost impossible due to the massive growth in debt of all types: government, corporate and individual.
The “too big to fail” banks announced second quarter earnings this morning (Tuesday). As expected, the numbers were horrendous, and the comments from their executives confirmed our non-V shaped recovery call. The CEO of Wells Fargo, which announced a loss of $2.4 billion, its first loss since 2008, stated, “Our view of the length and severity of the economic downturn has deteriorated considerably from the assumptions used last quarter.” The Wall Street Journal’s Aaron Back Tweeted, “JPM [JP Morgan] CFO 1Q we expected a sharp downturn followed by a rapid recovery. Now we expect something ‘much more protracted.’” Then the humor, CNBC reported JPM “beat” expectations with “strong” earnings. In reality, their net income fell by over 50% compared to the same quarter last year. Same story with Citigroup which “beat” expectations as net earnings fell 73%! And, more worrisome is the monumental increase in loan loss reserves reported by these banks.
The following chart prepared by economist Lance Roberts of Real Investment Advice illustrates the tremendously weakened data in July 2020 compared to January.
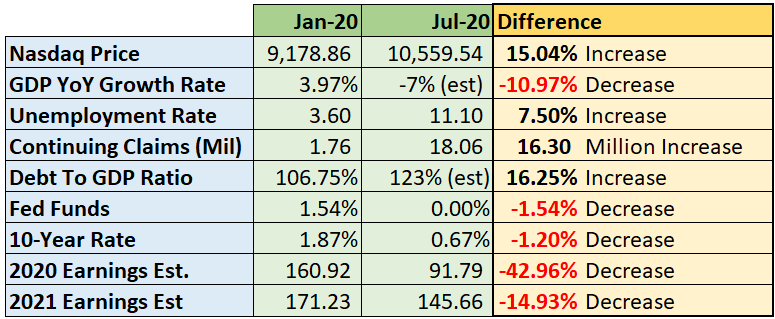
At this point, even the arrival of a COVID-19 vaccine will not prevent the economic damage which is already “baked in the cake.” A market being led by a handful of vastly overvalued companies is not a strong market. As stated by Lance Roberts, “Such means the overall performance of the S&P 500 is not representative of the market as a whole. It also means the index performance hinges on a very small group of stocks.” Absent this small number of companies, the S&P 500 Index performance would be weaker than that reported in the headlines.
The movement of high-flying tech companies have pushed indexes higher at the same time their earnings are falling. The most similar bubbles to the current situation are those peaking in 1929 and 2000. But the following is one which many investors might not be familiar with, that of Sir Isaac Newton’s experience with the South Sea Company. For the most part, bubbles end the same way.
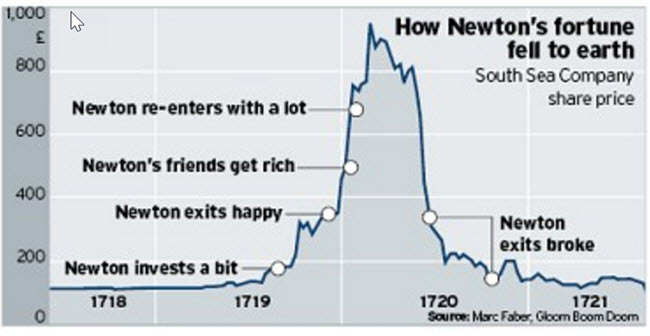
While most stocks are significantly overvalued, the contribution of the five largest market capitalization companies has added substantially to bubble valuations. As Bob Farrell stated, “Markets are strongest when they are broad and weakest when they narrow to a handful of blue-chip names.” Currently, the market reeks of bad breadth.
The S&P 500 Index closed at 3,185 up 1.8% for the week. The yield on the 10-year Treasury Note fell to 0.63%. Oil prices remained at $41 per barrel, and the national average price of gasoline according to AAA rose to $2.20 per gallon.
© 2020. This material was prepared by Bob Cremerius, CPA/PFS, of Prudent Financial, and does not necessarily represent the views of other presenting parties, nor their affiliates. This information should not be construed as investment, tax or legal advice. Past performance is not indicative of future performance. An index is unmanaged and one cannot invest directly in an index. Actual results, performance or achievements may differ materially from those expressed or implied. All information is believed to be from reliable sources; however we make no representation as to its completeness or accuracy.
Securities offered through First Heartland Capital, Inc., Member FINRA & SIPC. | Advisory Services offered through First Heartland Consultants, Inc. Prudent Financial is not affiliated with First Heartland Capital, Inc.
