Executive Summary
If earnings are the backbone of stock prices, the question today should be: when earnings tumble, should stock prices continue rising? Some might say that the stock market is “looking through” this set-back and is pricing in a return to normal. The risk to many investors is utilizing the buy-and-hold strategy under the assumption the market will bounce back quickly. In the fourth graph below, I highlight three different long-term periods when the Dow Jones Industrial Average (DOW) did not snap back quickly. Subsequent to the 1929 crash it took 25 years for the DOW to recover. Between the mid-1960s and the early 1980s the market was net flat for 15 years. And, after the Technology Bubble peaked, it took the DOW 12 years to recoup losses. Also of note, Japan’s Nikkei 225 Index which peaked in 1989 remains 42% below its peak and requires a 71% gain to get back to its prior high. I believe investors will need a strategic, tactical approach identifying the market cycle, the macroeconomic environment, and intermediate trends in order to successfully navigate the storm which is brewing.
Please proceed to The Details for more graphs and information on today’s risks and how to navigate them.
“Of this I am certain, that if we open a quarrel between the past and the present, we shall find that we have lost the future.”
–Winston S. Churchill
The Details
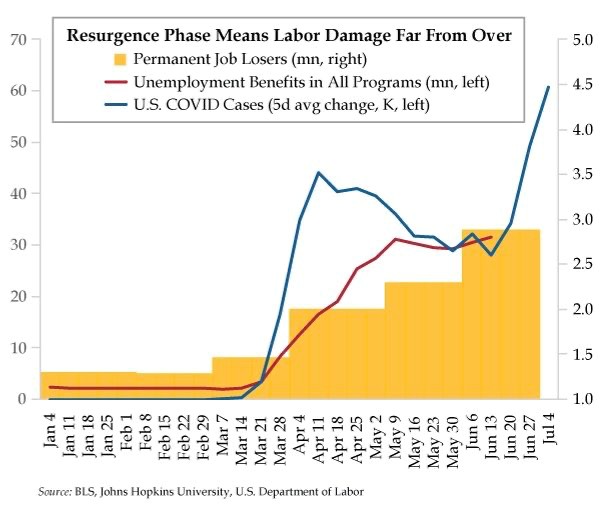
At this point, it seems apparent to almost everyone that the stock market has reached peak absurdity. But, in case there remains any hesitation, let’s review some current financial, social, and geopolitical events. For starters, this past weekend saw a confluence of deadly violence in major cities around the U.S. Next, we learned the rate of change in new COVID-19 cases is accelerating. And, while the death rate is improving, the economic spillover effects continue. Last Thursday the media extolled the June payroll report, and at the same time ignored the fact that the increase in “permanent” job losses was reminiscent of that seen during the Great Recession.
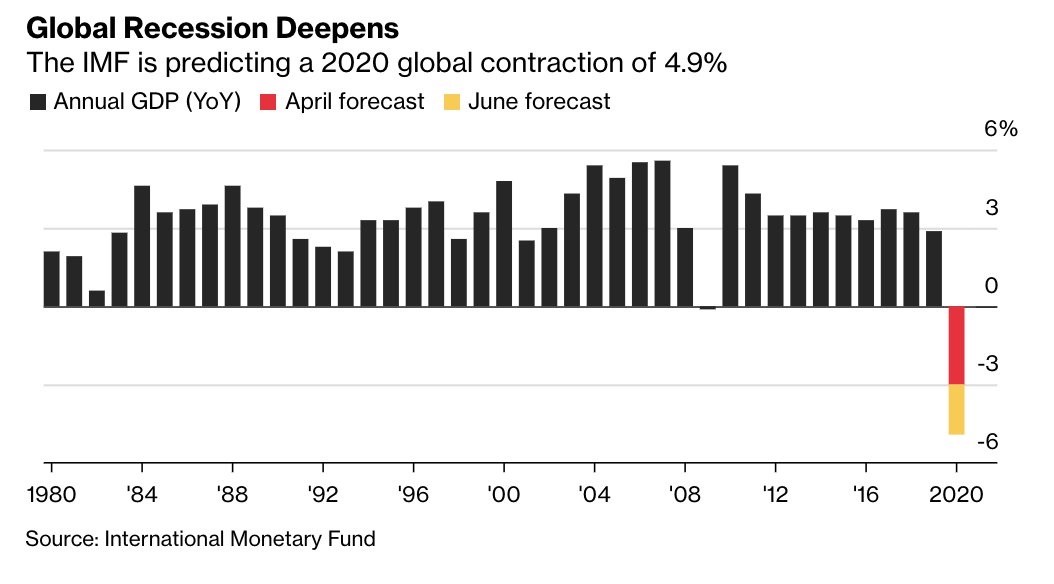
Real GDP growth for the first quarter 2020 was -5%. The current estimate for the second quarter from the Atlanta Fed GDPNow model is -35.2%. Additionally, the International Monetary Fund (IMF) reduced their estimate of global growth for the year 2020 to -4.9%. Does 2020 stand out in the graph below?
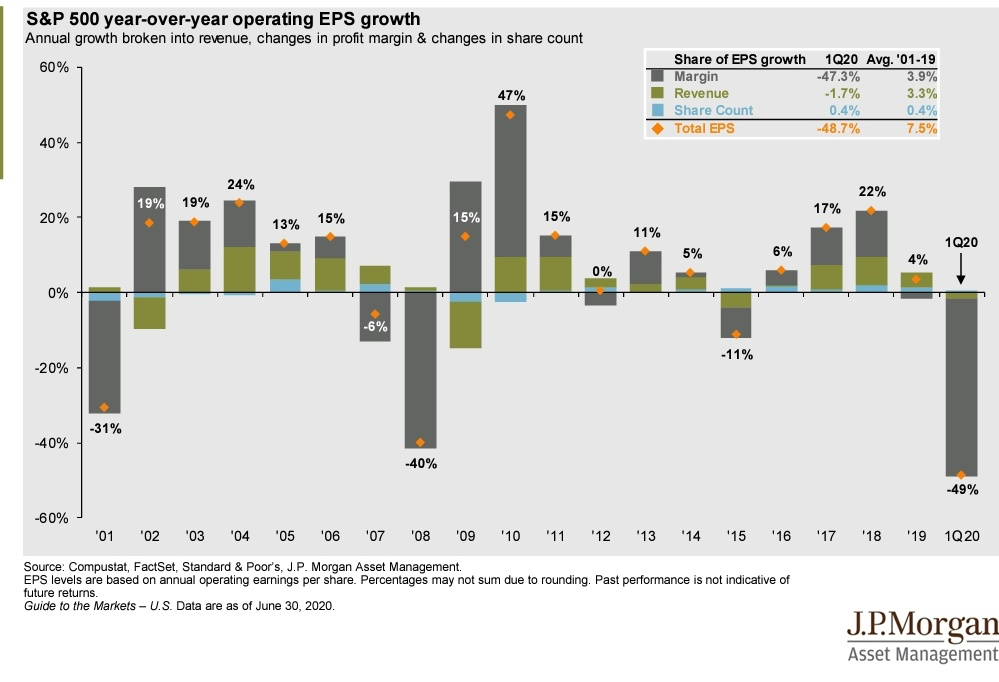
The backbone of stock prices is the income generated by these companies. The chart below illustrates the devastating results for the first quarter 2020. First quarter operating earnings for the S&P 500 fell 49% year-over-year. Based upon estimates from the S&P Dow Jones Indices website, second quarter operating earnings are expected to fall at least 57%.
If earnings are the backbone of stock prices, then when earnings fall through the floor should stock prices continue rising? Some might say that the stock market is “looking through” this set-back and is pricing in a return to normal. In recent missives, I have outlined how the current debt environment will prevent a quick economic snapback. Also, the unknown factor of the lingering pandemic creates much uncertainty. Markets typically do not like uncertainty. One my favorite economists, Dr. Gary Shilling, discussed the state of the stock market in an interview on CNBC today (Monday). As reported, he stated “Stocks could be poised for a big drop similar to the market’s decline during the Great Depression…Shilling said the stock market could plunge between 30-40% over the next year as investors realize the economic recovery from the coronavirus recession could take longer than expected. ‘I think we’ve got a second leg down and that’s very much reminiscent of what happened in the 1930s where people appreciate the depth of this recession and the disruption and how long it’s going to take to recover,’ he said.”
The danger to most investors is they are placing faith in the “buy-and-hold” strategy assuming the market will quickly “bounce-back.” What if that does not happen this time? Buy-and-hold performs well during long-term (secular) bull markets. Especially, when starting from undervalued initial levels. Typically, during such markets, volatility remains low, posing less risk of sudden downturns.
However, history has proven that during secular bear markets, volatility remains high and risk of loss even higher. A secular bear market can last anywhere from a couple years to a decade or longer. Most investors today are too young to remember investing during previous long-term bear markets. The question on investors’ minds today should be: if the market fell over 50% pulling portfolio balances down, could they financially survive an extended period of loss? Let’s review a few examples from the past.
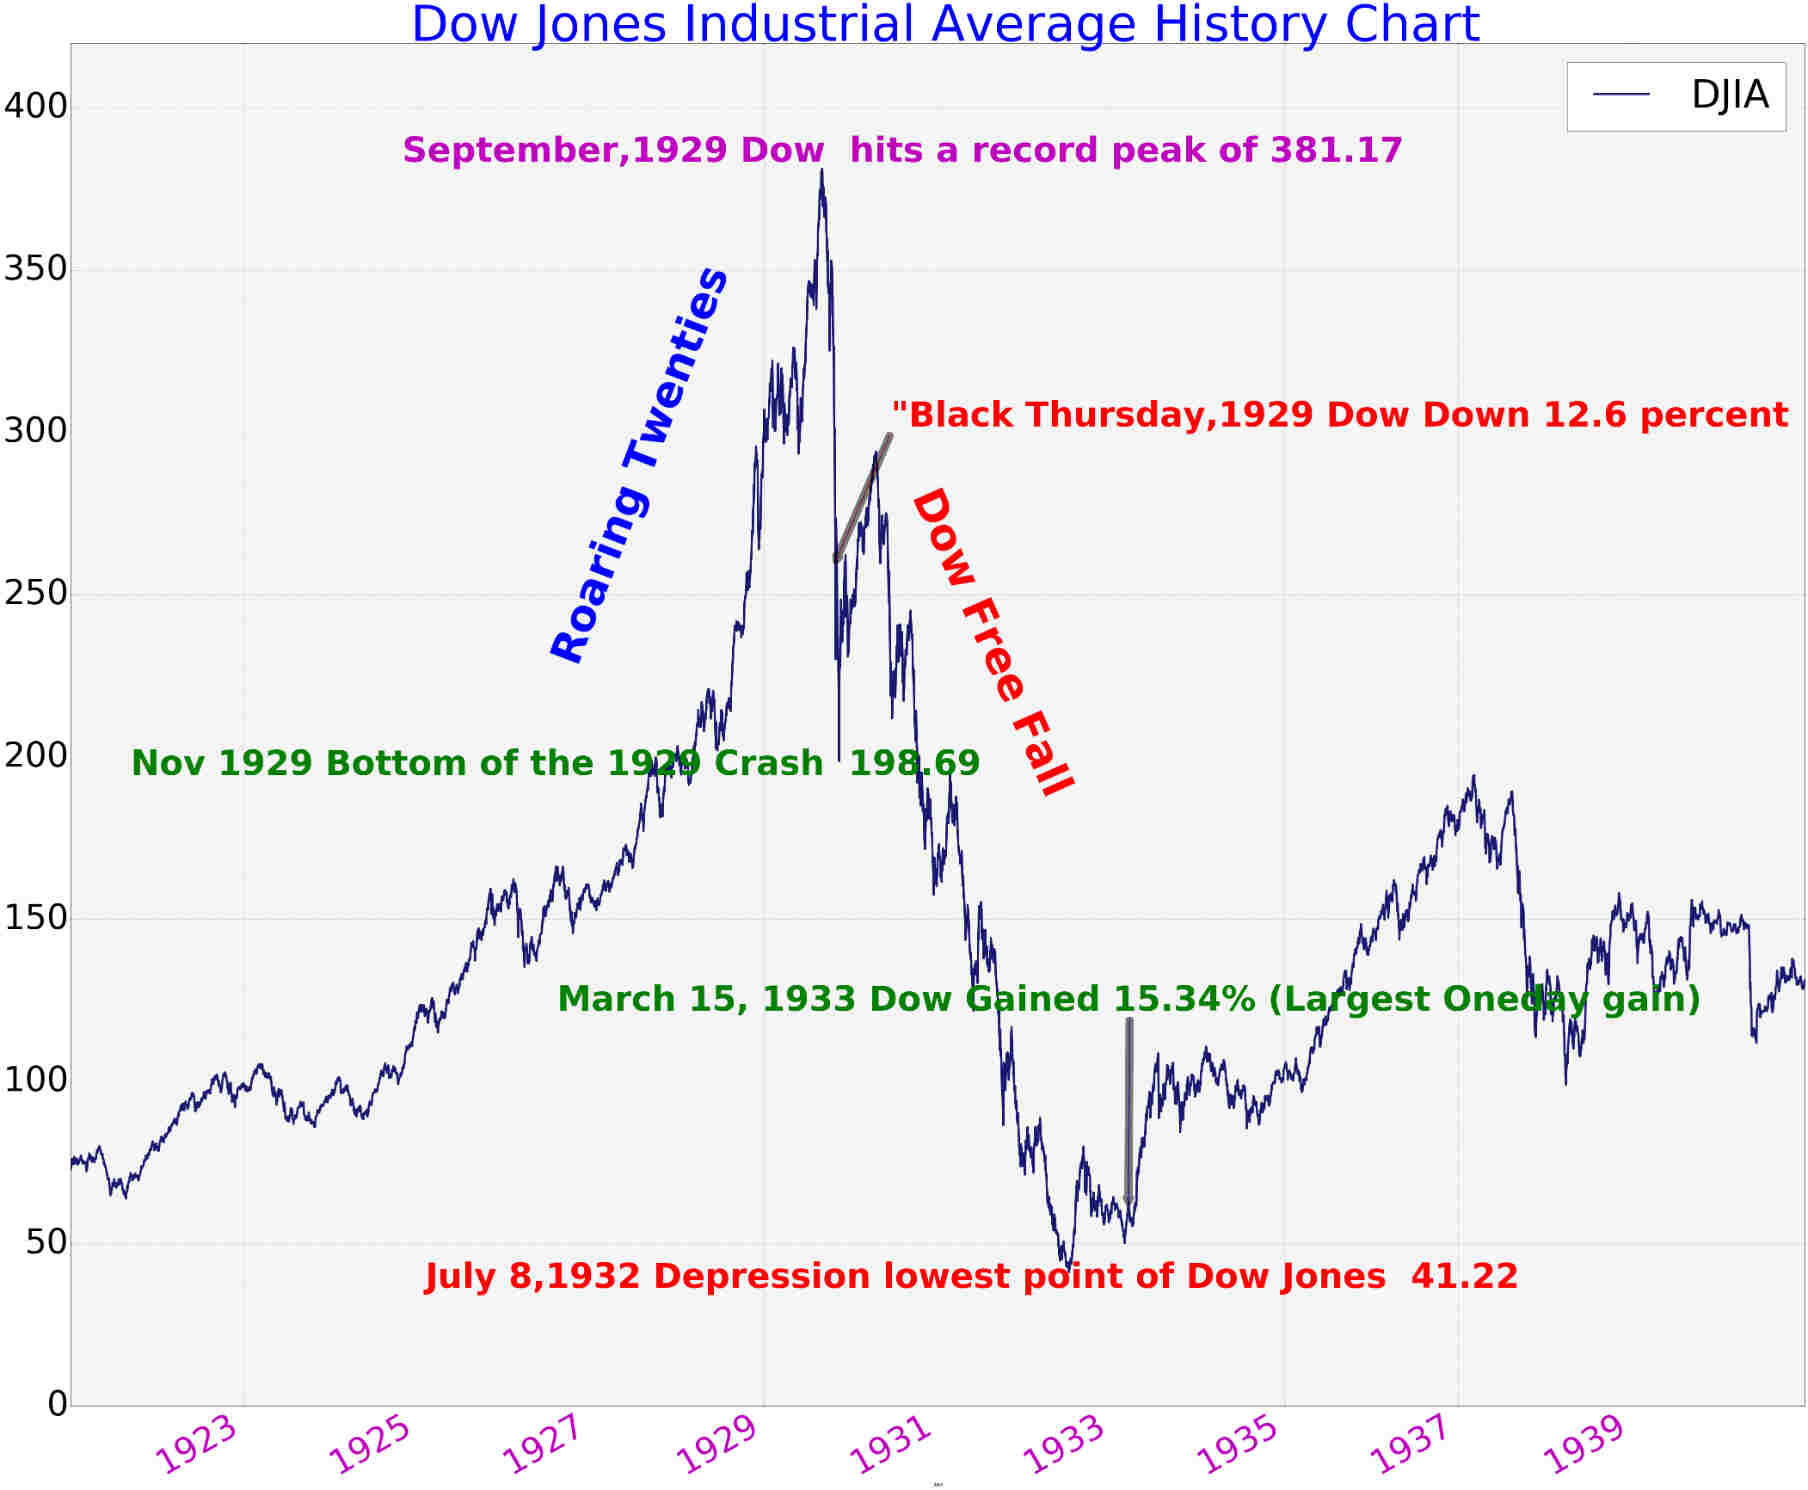
In the chart of the Dow Jones Industrial Average (DOW) below, I have highlighted three periods in different colors. While the numbers are small and hard to read, I will summarize these periods. First, the period in red illustrates the stock market crash in 1929 and the subsequent recovery.
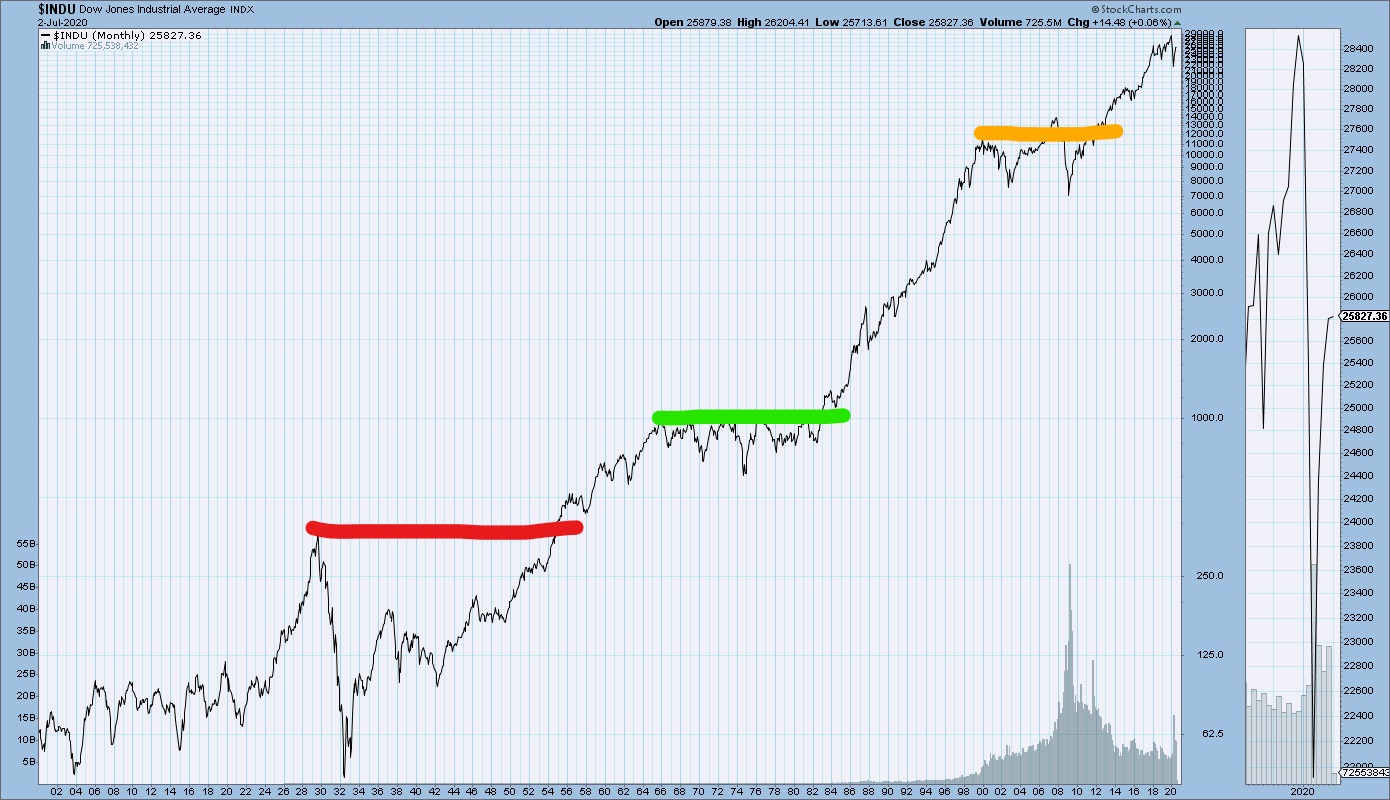
On September 3, 1929, the DOW peaked at 381.17. By July 8, 1932, less than three years later, the DOW had plunged 89%. If you were waiting for the bounce-back, you were waiting a long time. It took the DOW almost 25 years to recoup the bear market losses. See the highlights below.
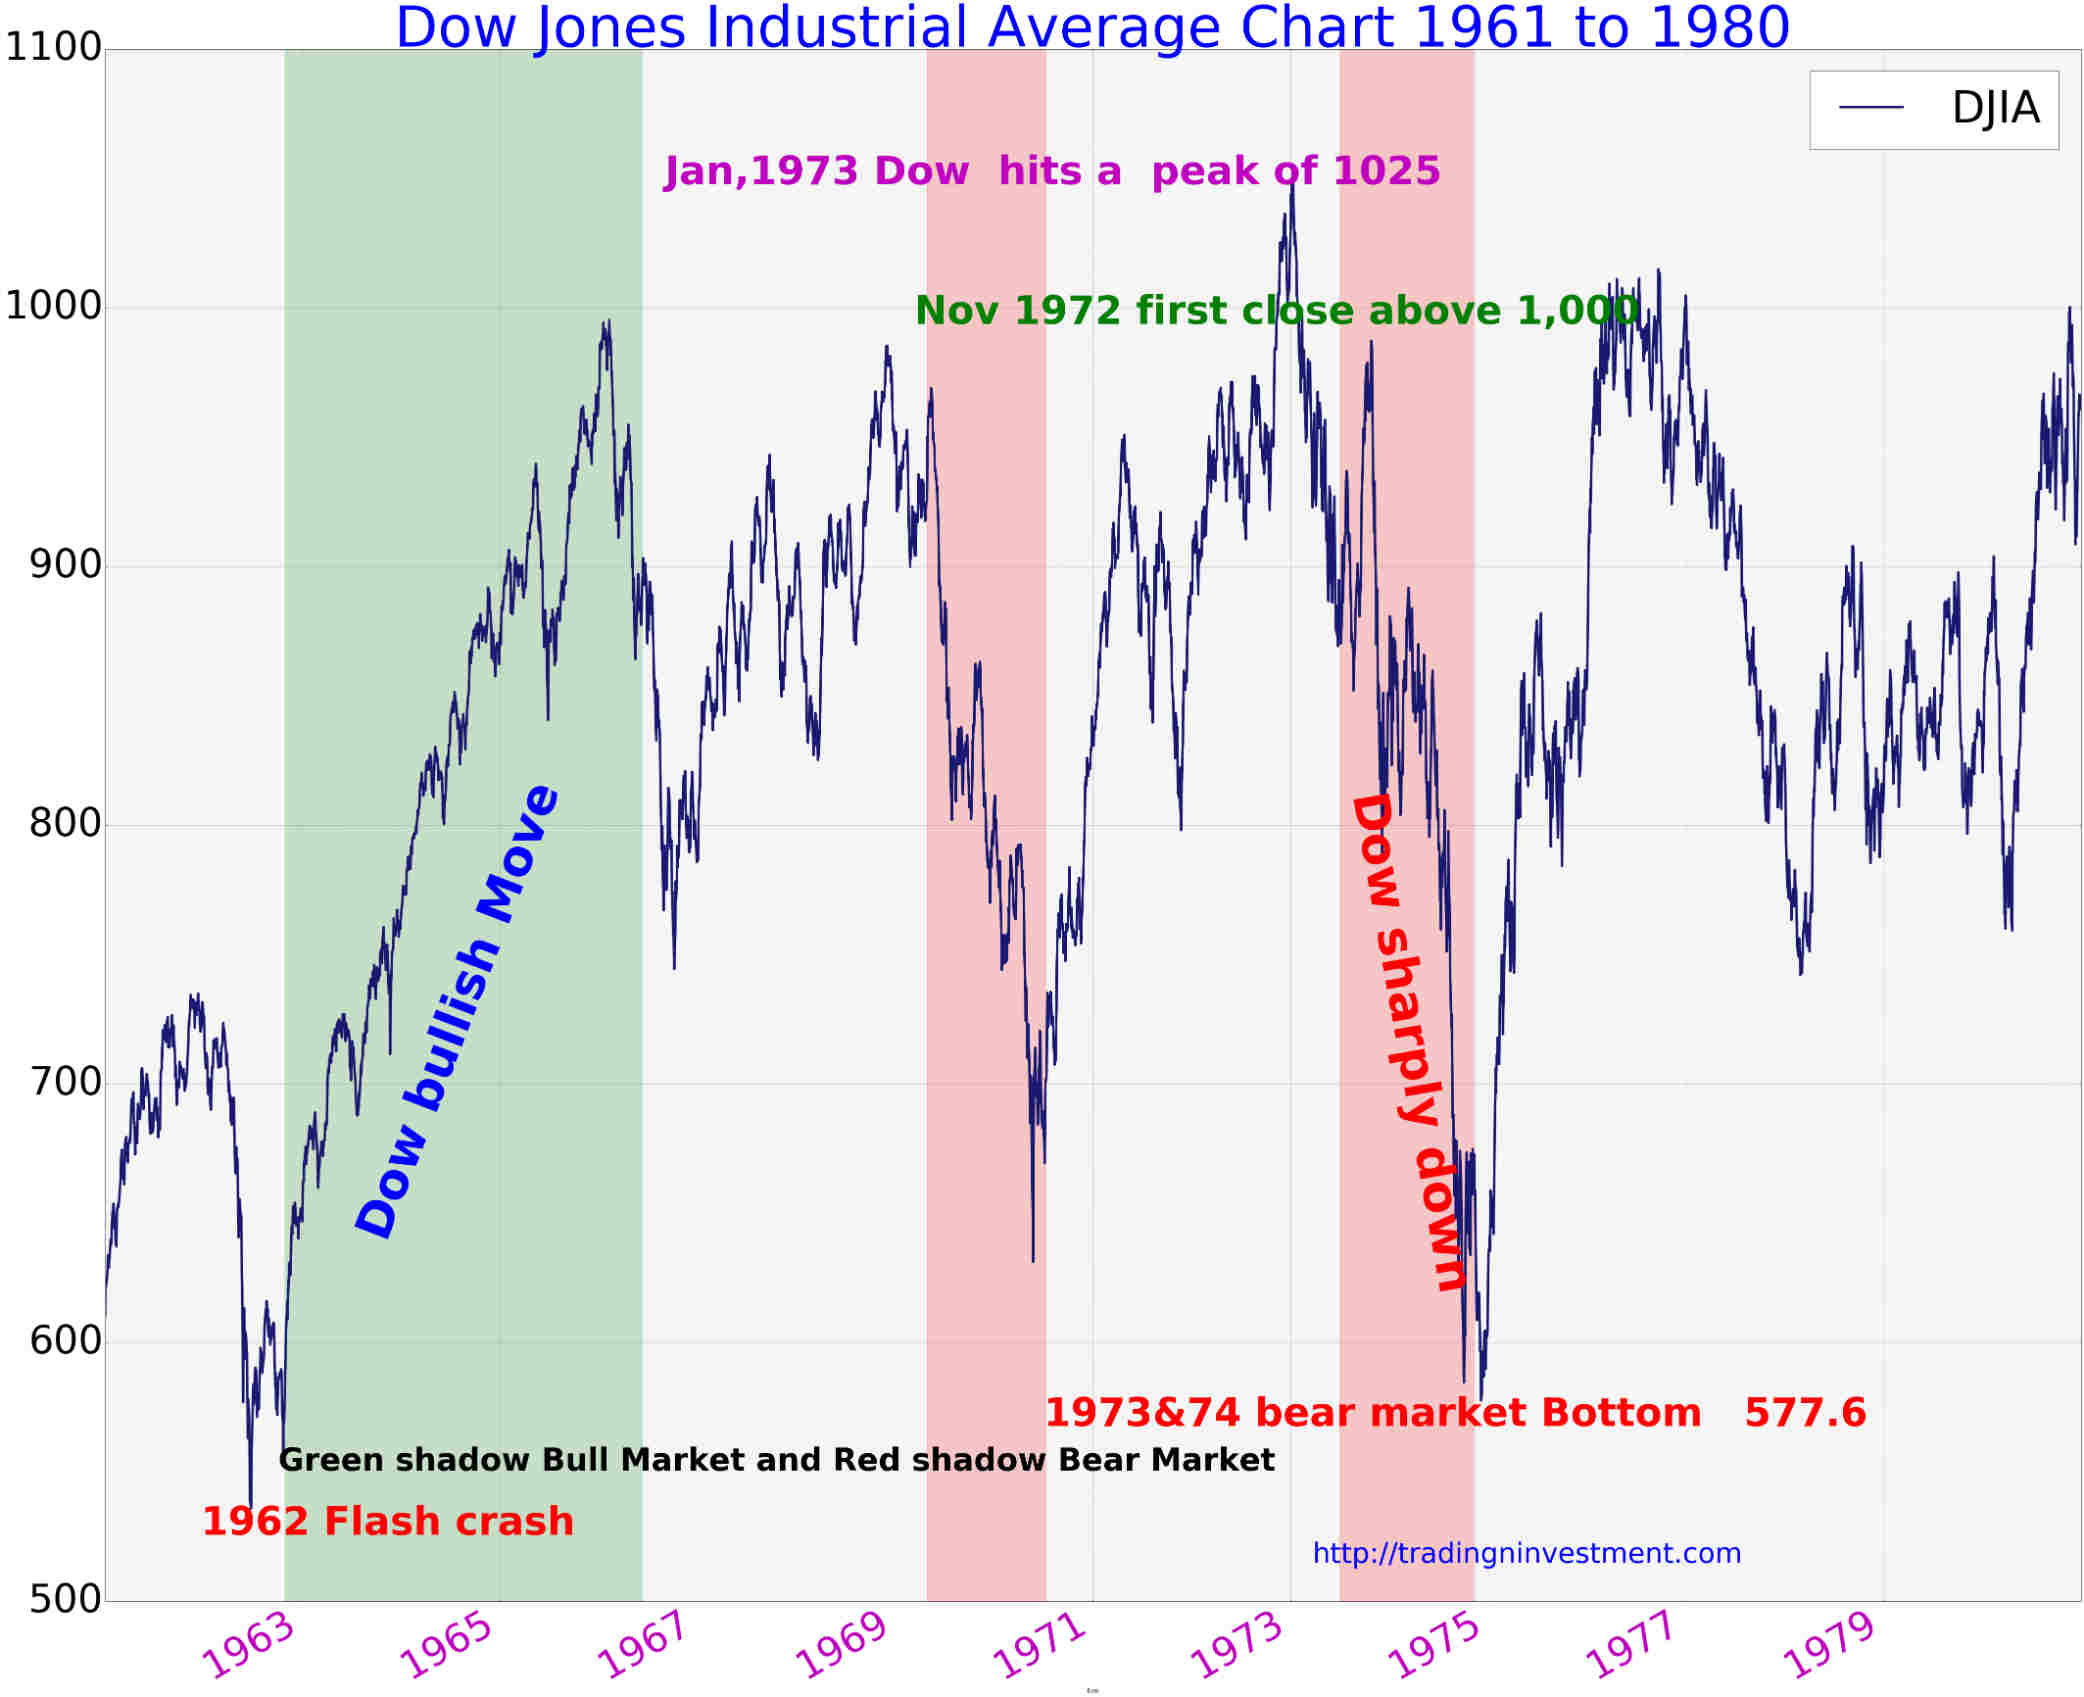
The second go-nowhere span ran from the mid-1960s to the early 1980s and is highlighted in green in the first DOW chart. This yo-yo period saw a 44% drop from 1973 to 1974. The entire net-flat period encompassed about 15-years. See below.
And finally, the most recent period, highlighted in orange, culminated with the Technology Bubble peak on January 14, 2000, when the DOW hit 11,723. The DOW’s last reunion with that number was at the end of November 2011, almost 12-years post the Tech Bubble high. Will the DOW have another reunion with this number?
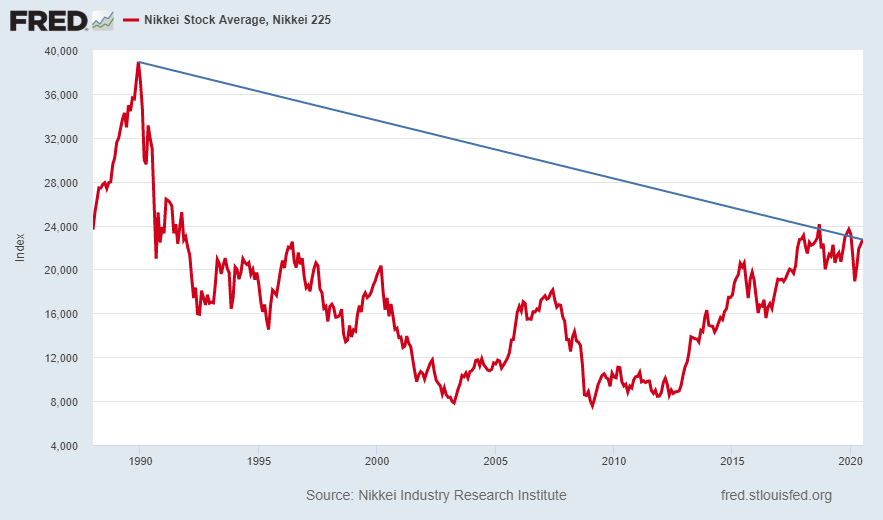
Our fearless Federal Reserve Bank leaders have been following in the footsteps of the Bank of Japan for over a decade. Japan’s Nikkei 225 Index peaked in 1989 and to this day remains 42% below the peak. Over 30-years later some investors could be holding-on waiting to climb back another 71% to reach the 1989 peak. That is how math works. It remains down 42%, but requires a gain of 71% to recoup the losses. See a chart of the Nikkei 225 below.
The stock market is moving in the opposite direction of corporate earnings and the overall economy. Market sentiment is hanging on “hope.” “Hope” which will likely not arrive as planned, as it is being blocked by unprecedented levels of debt.
The danger to investors is succumbing to the buy-and-hold philosophy, leaving them vulnerable to significant market losses. Even diversified portfolios are at risk. There is an old Wall Street adage which says, The only thing that goes up in a down market is correlation. That correlation, combined with the potential for the bear market to be more severe than many expect, could put investors in a position where it could take a decade or longer to recover, as shown in the examples above.
This bear market more than others, due to program trading and the rise in volatility, combined with near-zero percent Treasury yields, could demand a different approach to successfully traverse. I believe a strategic, tactical approach identifying the market cycle, the macroeconomic environment, intermediate trends, and relative strength will be necessary to successfully navigate the storm that is brewing. Fortunately, Prudent Investment maintains such an approach.
The S&P 500 Index closed at 3,130 up 2.9% for the week. The yield on the 10-year Treasury Note rose to 0.67%. Oil prices increased to $41 per barrel, and the national average price of gasoline according to AAA remained at $2.18 per gallon.
© 2020. This material was prepared by Bob Cremerius, CPA/PFS, of Prudent Financial, and does not necessarily represent the views of other presenting parties, nor their affiliates. This information should not be construed as investment, tax or legal advice. Past performance is not indicative of future performance. An index is unmanaged and one cannot invest directly in an index. Actual results, performance or achievements may differ materially from those expressed or implied. All information is believed to be from reliable sources; however we make no representation as to its completeness or accuracy.
Securities offered through First Heartland Capital, Inc., Member FINRA & SIPC. | Advisory Services offered through First Heartland Consultants, Inc. Prudent Financial is not affiliated with First Heartland Capital, Inc.

