Executive Summary
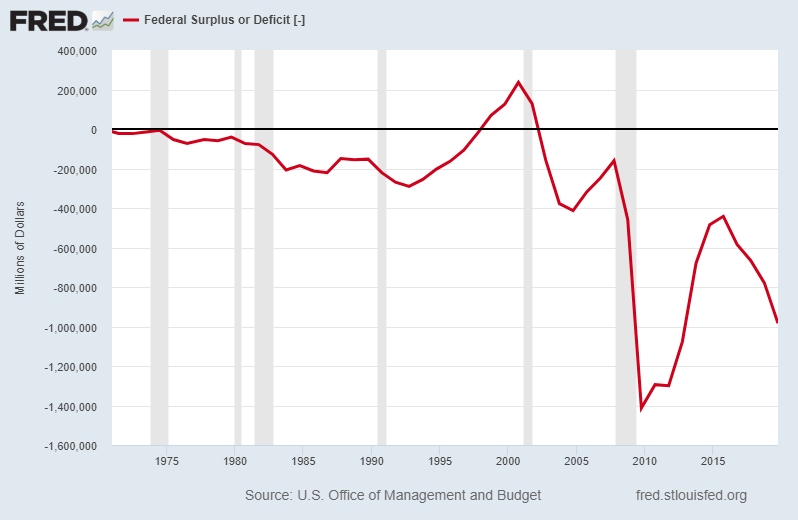
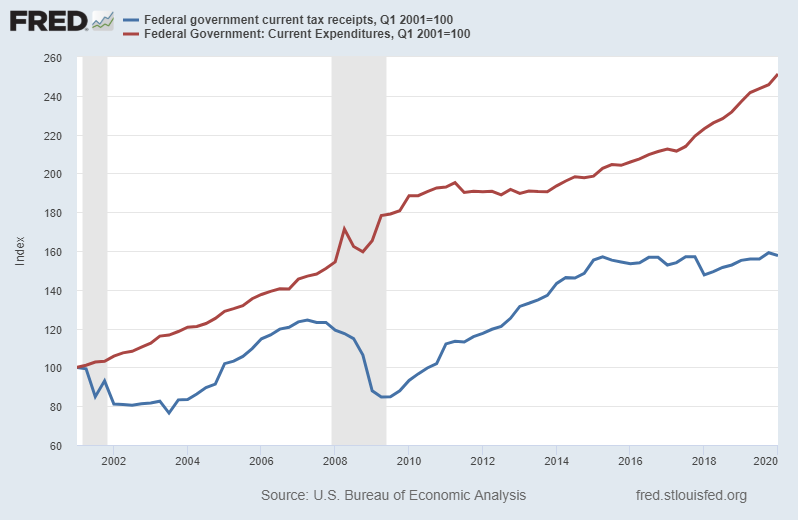
The fiscal dilemma for the Federal Government did not begin with COVID-19. Although, the impact of the “solutions” for the pandemic are compounding the predicament. Adding the effects of the COVID-19 recovery plans, the 2020 deficit was projected in April of this year by the Congressional Budget Office (CBO) to explode to $3.7 trillion. (See the two graphs for visuals of the deficit from 1971 forward and a comparison of tax revenues versus expenditures.) Debt in and of itself is not bad. The problem arises when debt grows at a faster rate than the economy. Debt has grown at roughly twice the rate of the economy for the past 19-years. The debt-to-GDP ratio will likely be close to 140% by fiscal year-end. Since none of our policymakers (on either side) seem to have the intestinal fortitude to tackle our deficit and debt, the path is set.
Please proceed to The Details to learn my thoughts on the potential outcomes.
“Our dilemma is that we hate change and love it at the same time; what we really want is for things to remain the same but get better.”
–Sydney J. Harris.
The Details
The fiscal dilemma for the Federal Government did not begin with COVID-19. Although, the impact of the “solutions” for the pandemic are compounding the predicament. The issues with the deficit began to build shortly after President Nixon abandoned the gold standard in 1971. The graph below illustrates annual deficits through 2019, note the unrelenting accumulation of deficits occurring after the crash of the Technology Bubble in 2000. Adding the effects of the COVID-19 recovery plans, the 2020 deficit was projected in April of this year by the Congressional Budget Office (CBO) to explode to $3.7 trillion. However, that number excludes plans currently being tossed around to inject another $1 to $3 trillion in new government stimulus. The higher end could push the deficit for 2020 to around $6.7 trillion.

Debt in and of itself is not bad. The problem arises when debt grows at a faster rate than the economy. The longer debt accumulates at a faster rate than the economy which generates the income used to service the debt, the more difficult – if not impossible – it is to reverse the dilemma. Since January 2001 Federal debt in the U.S. has grown at an average annual rate of 7.7%. The economy (nominal GDP) grew at 3.9% annually for this 19-year period. So, debt has grown at roughly twice the rate of the economy for the past 19-years. Instead of “saving” during the non-recession years in order to maintain a cushion for bad times, spending increased whether or not revenues increased.

Enter COVID-19 and a bad situation becomes impossible. Let’s assume the deficit for this year ends up around $5 trillion. At the same time, over 47 million people have filed for unemployment claims over the past 14 weeks. Continuing claims are around 20 million. That means at least 47 million previously employed people were not generating taxable income for some period of time, which only exacerbates the situation.
U.S. Gross Domestic Product (GDP) is roughly $20 trillion. Currently, the national debt is over $26 trillion and is likely to grow to at least $28 trillion this fiscal year. The debt-to-GDP ratio at $28 trillion in debt is 140%. No precedent has been set over the past 19 years of being able to grow the economy faster than the debt. Until the debt is addressed, the impact of such a tremendous debt load will be reduced growth in years ahead. Since the real annual growth rate over the past decade has only averaged around 2%, there is not a lot of room for reduction going forward without entering perpetual recession.
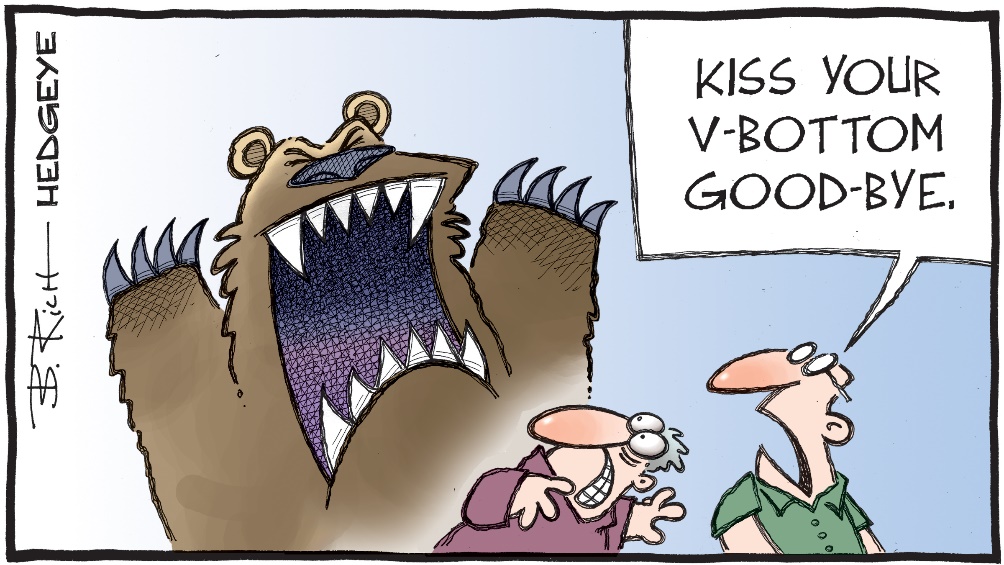
Many financial pundits are proclaiming a fantastic “V” shaped recovery is in the works. The implication of course is the economy will soar back to pre-COVID-19 levels shortly after bottoming. As explained in last week’s newsletter, a bounce off of the bottom once the economy is fully up and running is to be expected. But, the principles of mathematics are involved. As an example, today (Monday) pending home sales were announced to have jumped 44% month-over-month. That sounds outstanding. However, the level of pending sales was over 10% below the same month in the prior year. It is all about perspective. If something were to fall 50%, no matter how outstanding a subsequent 80% jump would sound, it would still require an additional 11% bounce to reach the pre-drop level.

When it comes to the national debt, it is important to examine the details. The debt results from a shortage of tax revenues versus Federal government expenditures. Tax revenue is mainly derived from income taxes and payroll taxes. Payroll taxes are used to pay Social Security and Medicare benefits. Currently, there is no surplus in taxes collected annually compared to benefits paid; therefore, payroll taxes are not available for other Federal expenditures. That leaves the individual and corporate income tax collections. For 2020, individual income taxes will likely be around $1.7 trillion and corporate income taxes about $0.2 trillion for a total of $1.9 trillion.
The pre-COVID estimated annual expenditures totaled about $4.8 trillion. Backing-out Social Security and Medicare expenses leaves a net of around $3.1 trillion. Then, add non-budgeted stimulus programs. These programs could add anywhere from $1 to $4 trillion of additional spending for total expenditures between $4.1 and $7.1 trillion. All of this spending is to be supported by about $1.9 trillion in income taxes. Is the dilemma becoming more clear?
Without knowing the full impact on future years of COVID-19, the CBO projects annual deficits of around $1.3 trillion through 2030. Therefore, the national debt balance could easily exceed $45 trillion by 2030. With annual future spending, net of SS and Medicare, of at least $3 trillion supported by income taxes of close to $2 trillion, the problem is only compounding.
Some say the only solution is to raise taxes on the rich. Let’s examine that a little closer using a study performed by the Tax Foundation using 2017 data. In 2017 the top 10% of income earners paid 70% of income taxes. This segment had adjusted gross income (AGI) of $5.22 trillion and paid taxes of $1.12 trillion, resulting in a tax rate on AGI (not on “taxable income”) of 21.5%. In order to plug the annual hole in the budget using only revenues, assuming politicians will never reduce expenditures, the effective tax rate on AGI on the top 10% of income earners would need to increase to over 46%. This assumes future expenditures are not increased for additional stimulus programs and revenues are not drastically affected by the future impact of the pandemic; two big assumptions.
Additionally, this higher tax rate would merely support projected budget levels under the assumption that such hikes would not negatively impact economic growth. A topic for future discussion. And, the huge increase in tax rates would not even begin to chip away at the massive national debt balance. If the debt balance is not reduced, as stated previously, the expectation of future growth drops significantly. In a 1% growth environment, would earnings and tax revenues not fall below projected levels, thus requiring even higher tax rates to fill the gap? And therein lies the real problem. The debt balance is already too high. The slightest increase in interest rates would be calamitous to the budget.
In the end, knowing expenditures will never be reduced; and considering current projections indicate the Social Security and Medicare trust funds will be depleted by 2034 leaving over $50 trillion in future liabilities; the options for resolving the dilemma are limited. Unfortunately, the train left the station long ago. COVID-19 assured that it isn’t going to make it back. The only options left to managing our mountainous debt have tremendous negative consequences. Option one, default. This, in my opinion will never happen as the Federal Reserve will create money to avoid default. The other option is to attempt to make the debt balance smaller relative to the size of the economy. This is accomplished through significant inflation.
I will discuss my thoughts on the timing of the future consequences, including how to invest in such an environment, in future missives. In the meantime, since none of our policymakers (on either side) seem to have the intestinal fortitude to tackle our deficit and debt, the path is set.
The S&P 500 Index closed at 3,041 down 1% for the week. The yield on the 10-year Treasury Note fell to 0.64%. Oil prices decreased to $38 per barrel, and the national average price of gasoline according to AAA rose to $2.18 per gallon.
© 2020. This material was prepared by Bob Cremerius, CPA/PFS, of Prudent Financial, and does not necessarily represent the views of other presenting parties, nor their affiliates. This information should not be construed as investment, tax or legal advice. Past performance is not indicative of future performance. An index is unmanaged and one cannot invest directly in an index. Actual results, performance or achievements may differ materially from those expressed or implied. All information is believed to be from reliable sources; however we make no representation as to its completeness or accuracy.
Securities offered through First Heartland Capital, Inc., Member FINRA & SIPC. | Advisory Services offered through First Heartland Consultants, Inc. Prudent Financial is not affiliated with First Heartland Capital, Inc.

