Executive Summary
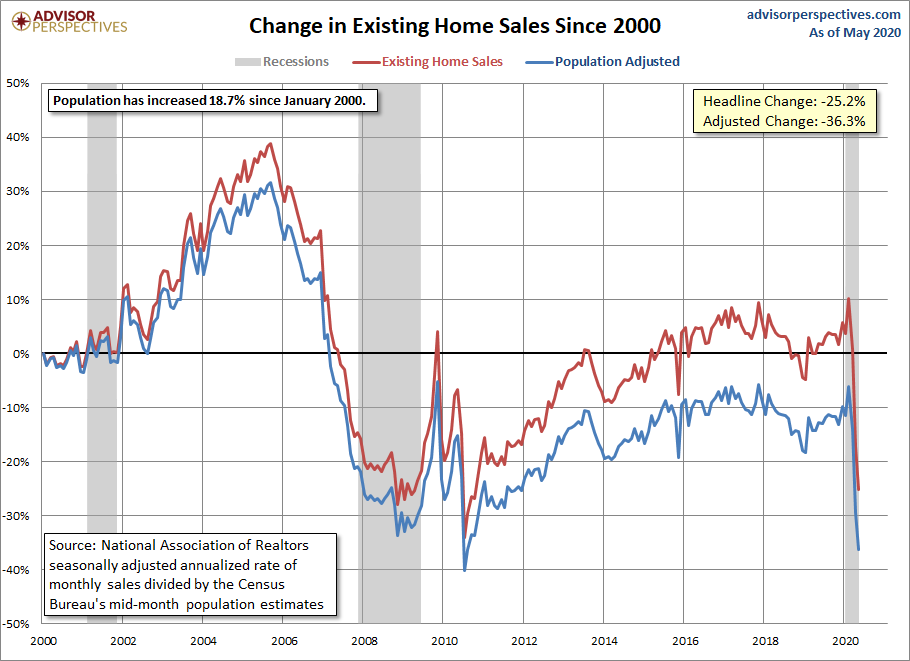
In this market update, I take a look at the macro real estate market – recognizing that real estate is local. The Atlanta Fed GDPNow forecast estimates second quarter annualized GDP will fall 45.5%. And as shown in the second graph below, existing home sales are 36.3% below where they were in the year 2000. The United States has moved to a renter nation over recent history due to the bubble prices (see fifth graph) in residential housing and lack of income growth. Historically, housing should track inflation, so home ownership is affordable. The loss of jobs resulting from COVID-19 means many are struggling to pay their mortgage and/or monthly rent. Next year’s growth rebound may not result in an economy stronger than pre-pandemic (see math lesson in The Details). Thus, the real estate recovery depends on the recovery of jobs and incomes, and the reversion of prices.
Please proceed to The Details for the full explanation of how GDP, unemployment, incomes and real estate are all interrelated.
“We’ve never had a decline in house prices on a nationwide basis.”
— Ben Bernanke, July 2005
The Details
With the stock market now making a mockery of corporate fundamentals as earnings plunge while stock prices rise to near all-time high valuations, how is real estate holding up? I am sure everyone has heard or read a story recently about a house being sold above asking price before the sign was fully implanted in the front yard. And, it is true when selling a house that real estate is local. In other words, markets vary by location, hence the statement: “The three most important things when buying real estate are: Location, Location, Location!” That being said, let’s examine how the real estate market is holding up on a macro-basis.
While the real estate market today is vastly different in many respects than prior to the Financial Crisis, it is reasonable to assume some disruption when the economy is expected to plunge 45.5% on an annualized basis in the second quarter. See the chart below from the Atlanta Fed utilizing their GDPNow model.
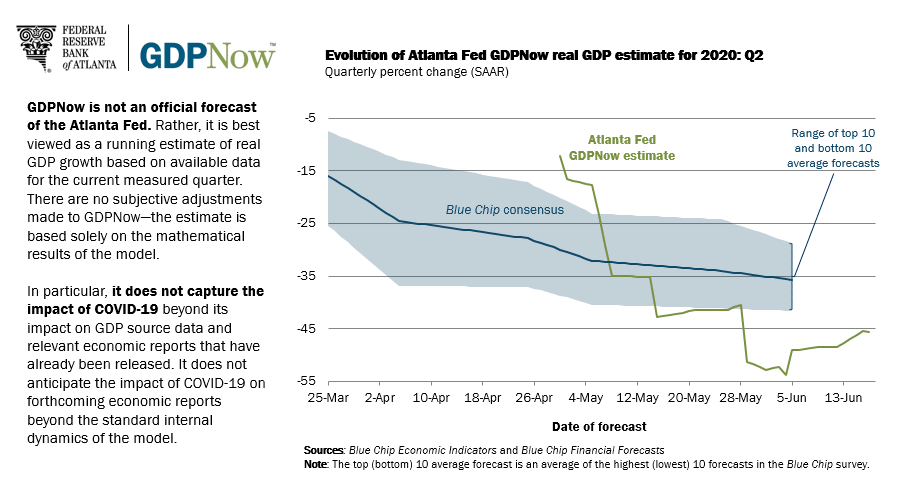
Now might be a good time for a brief mathematics refresher, as there are currently many pundits claiming next year the economy will soar at levels never seen before. When the economy plummets at unheard of rates of change, it would not be uncommon to subsequently have an outsized quarter of annualized growth. In fact, from a purely mathematic standpoint, if the economy falls 45.5% (as projected above), it will need to rebound 83.5% just to recapture the loss. So, it would be reasonable to experience an annualized growth rate in double-digits subsequent to such a dramatic loss. But what will likely be excluded from any reporting is perspective. Growth of even 20% after a 45.5% drop would leave the economy far below pre-crisis levels.
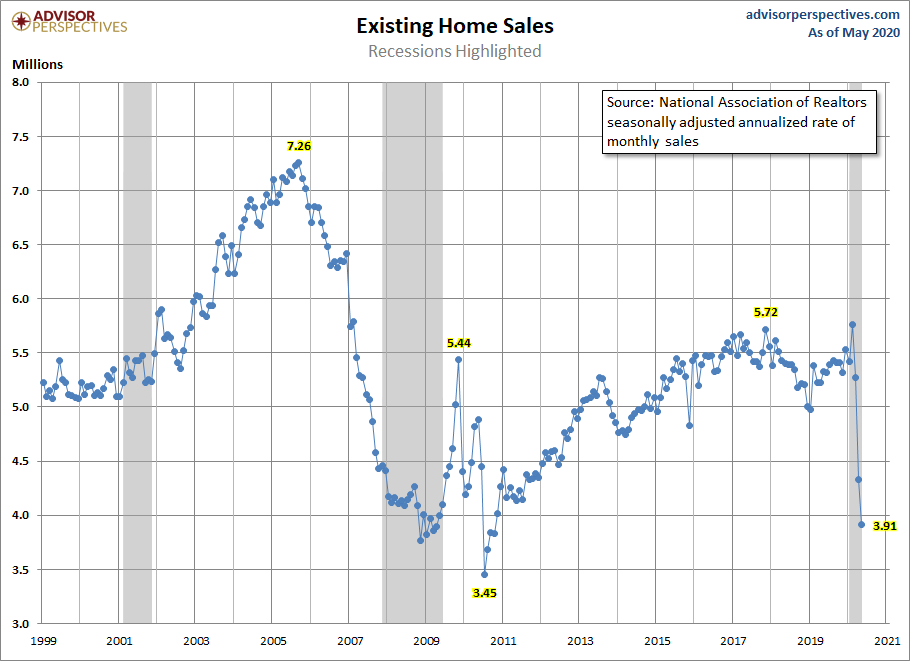
One of the most comprehensive indicators of the housing market is the level of existing home sales. Existing home sales comprise a much larger percentage of total sales than do new home sales. The chart below illustrates the recent plunge in existing home sales to levels near the bottom of the Great Recession, which represented one of the worst times in history for real estate.
To understand how bad the prior crisis was, and how weak the subsequent recovery, the chart below illustrates (blue line) the population-adjusted change in existing home sales compared to the beginning of 2000. At no time prior to the current crisis did population-adjusted existing home sales exceed the number of sales in 2000. And currently, sales are 36.3% below the amount of sales recorded over 20 years ago.
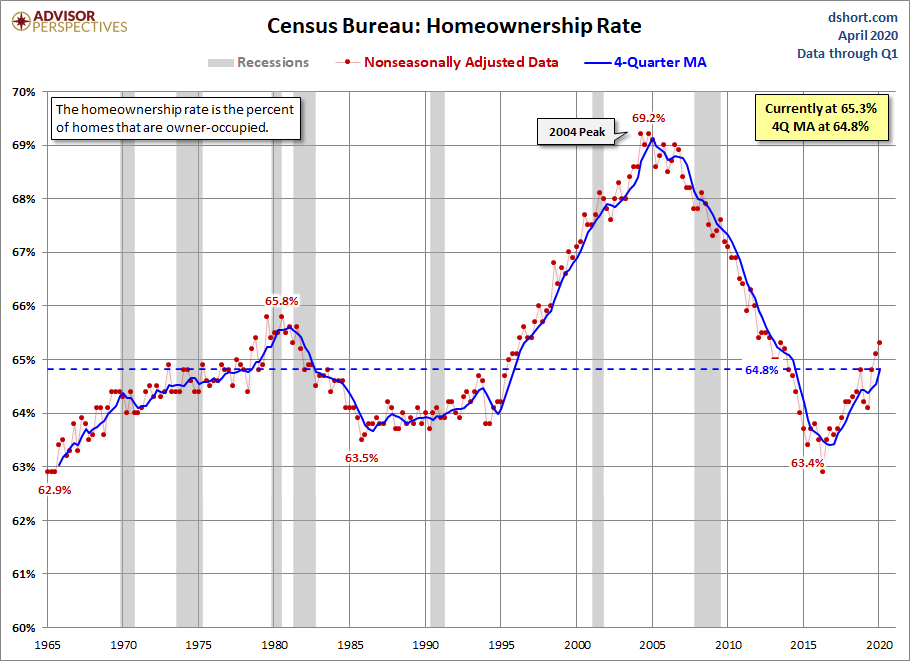
Part of why existing home sales never really rebounded is due to the move to renting versus purchasing. The graph below shows the huge drop in home ownership rates. The current rate of ownership is similar to that seen in the 1970’s.
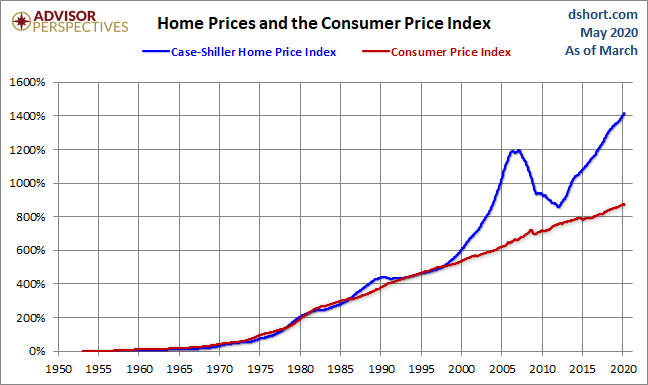
The price of residential real estate has also reached bubble territory similar to the stock market. Homes historically have appreciated at a rate close to the rate of inflation. Appreciation above that rate would put home prices out of reach for many buyers. The bubbles in real estate can easily be seen in the graph below. The Great Recession popped the prior bubble; however, before prices could fully correct, the Fed dropped interest rates encouraging leveraged purchases leading the U.S. into the second major real estate bubble since 1950.
The recent spike in unemployment due to COVID-19 and the weakening economy pushed the number of continuing unemployment claims to a level never seen before. Notice in the chart below the massive surge in claims on the far right side of the graph. You have heard the expression, “A picture is worth a thousand words!” This picture surely is.
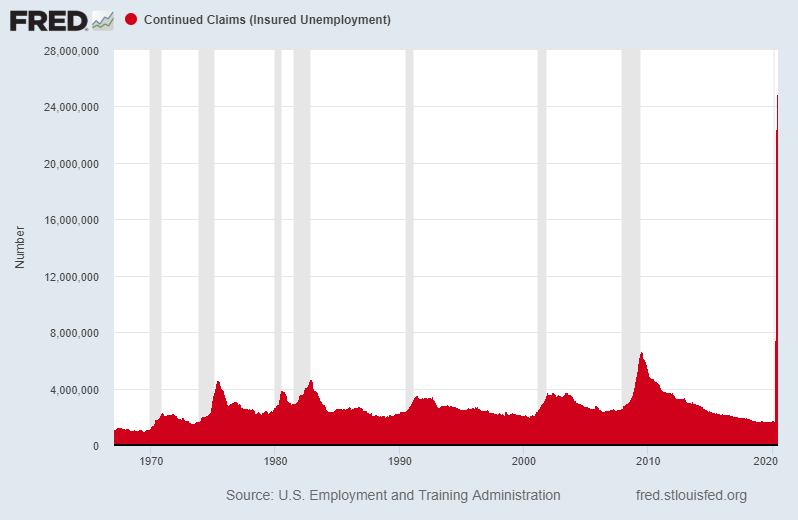
The cumulative number of first-time filers for unemployment benefits recently rose to over 45 million. Last week the number of new filers totaled 1.5 million, more than the 1.3 million expected. For some perspective, the prior all-time weekly record high was “only” 695,000 claims.
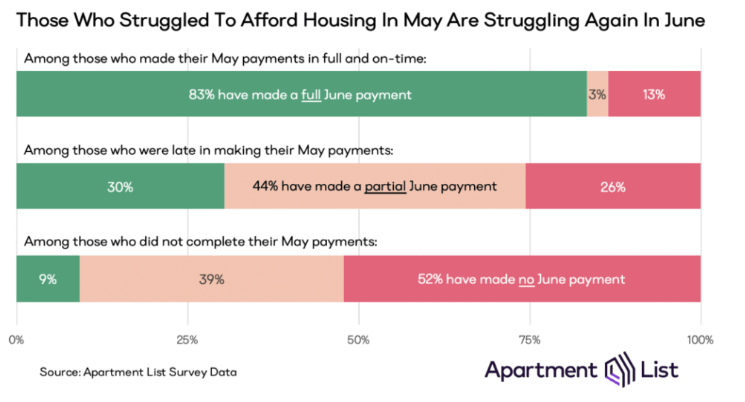
The loss of jobs has caused a rise in past due mortgage payments. Many in policy-making roles had hoped that by June the problems would be trailing-off, and a return to normal would be in sight. However, the chart below displays many homeowners continuing to struggle with mortgage payments in the month of June.
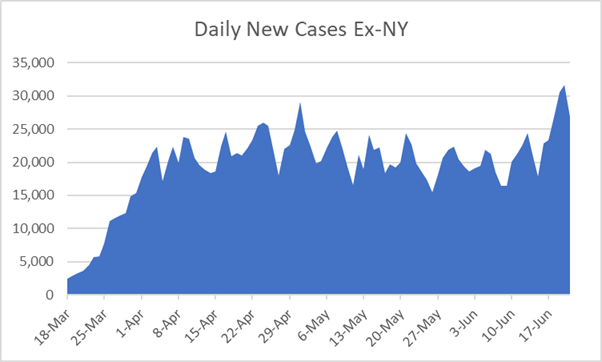
As COVID-19 testing increases, the number of confirmed cases also rises. (See the graph below from Hedgeye Risk Management, LLC) Because of this, states are hesitant to fully open-up their economies. The more time that elapses, the fewer number of businesses that will be able to fully recover. And therefore, the fewer the number of employees who will return to their jobs. The spillover effect will be severe and is the reason some economists, such as Gary Shilling, now expect the recession to continue into 2021.
The depth of the GDP drop this year, and possibly next year, will have a direct impact on the extent of any potential subsequent jump in economic growth. While it would be great to see a surge in growth, it is important to put the growth in perspective with the previous plunge, remembering the math involved. Simply put, a 50% drop requires a 100% gain just to get back to the starting point.
The lack of inventory combined with the move to a renter nation kept the number of sales down over the prior decade. The current crisis has pushed sales back to near Great Recession lows. The future of real estate depends upon the return of economic growth including household income. With that said, real estate is always local, so if a home down the street sold before it hit the market, that is not necessarily reflective of the larger real estate picture.
The S&P 500 Index closed at 3,041 up 1.9% for the week. The yield on the 10-year Treasury Note remained at 0.70%. Oil prices increased to $40 per barrel, and the national average price of gasoline according to AAA rose to $2.13 per gallon.
© 2020. This material was prepared by Bob Cremerius, CPA/PFS, of Prudent Financial, and does not necessarily represent the views of other presenting parties, nor their affiliates. This information should not be construed as investment, tax or legal advice. Past performance is not indicative of future performance. An index is unmanaged and one cannot invest directly in an index. Actual results, performance or achievements may differ materially from those expressed or implied. All information is believed to be from reliable sources; however we make no representation as to its completeness or accuracy.
Securities offered through First Heartland Capital, Inc., Member FINRA & SIPC. | Advisory Services offered through First Heartland Consultants, Inc. Prudent Financial is not affiliated with First Heartland Capital, Inc.

