Executive Summary
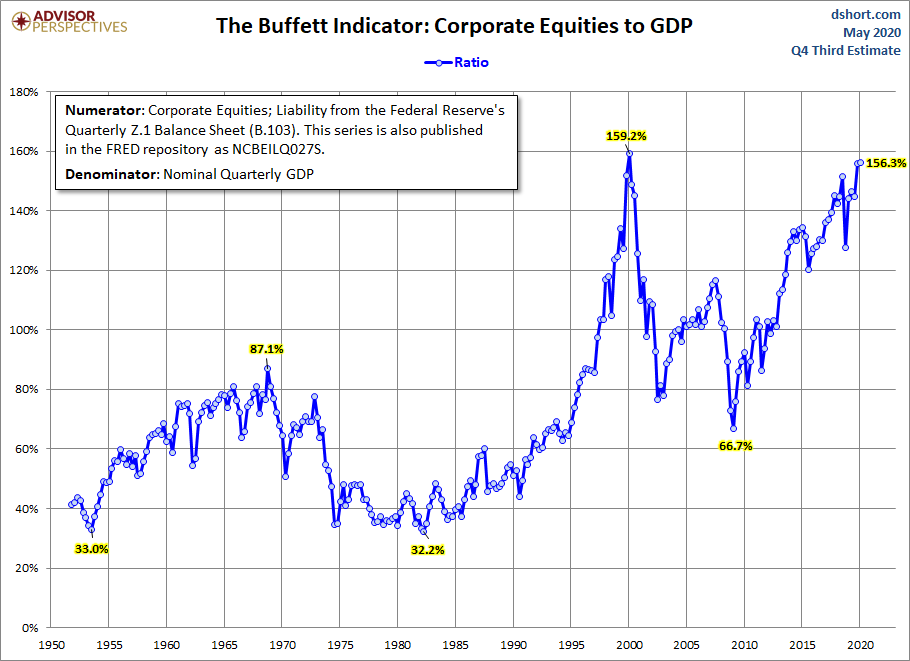
Presently, investors are rightfully confused by the diametrically opposed forces influencing markets. Many have asked: Why are the markets not dropping? There are two competing forces: economic reality versus Federal Reserve Bank efforts to save the day through more debt and money creation. With the onslaught of bad news including: a global pandemic, GDP expected to fall by over 50%, unemployment skyrocketing, Treasury yields dropping, and domestic riots, the question of why is legitimate. The current bear market bounce has again created significant market overvaluation as shown by the Buffett Indicator in graph two below. Additional contradicting data is highlighted by the disconnect between the stock and bond markets. Historically, the bond market has been a more reliable indicator of what is to come. The key to investing in these turbulent markets is understanding where the market is in its cycle.
For a better understanding of a cycle-based strategy, as utilized by us, please proceed to The Details.
“Even the intelligent investor is likely to need considerable willpower to keep from following the crowd.”
— Benjamin Graham
The Details
Presently, investors are rightfully confused by the diametrically opposed forces influencing markets. There are two competing forces; economic reality and the Federal Reserve Bank’s (Fed) attempt to obscure it. Reality includes: a global pandemic, domestic riots, over 40 million people filing unemployment claims, GDP plunging, loan defaults rising, corporate profits plummeting, and Treasury yields sinking. On the other side, there is the Fed increasing their balance sheet by over $3 trillion, purchasing government, corporate and even junk bonds. And of course, financial media cheerleaders touting a late year “V” shaped economic recovery.
The COVID-19 crisis has shuttered businesses and cut the economy by half. According to the Atlanta Fed’s GDPNow forecasting model, second quarter GDP is expected to fall by 52.8%! See their chart below.

As mentioned in last week’s newsletter, first quarter S&P 500 net earnings compared to first quarter 2019 crashed 64%, and this was before the full onslaught of the COVID-19 lockdowns. With the second quarter including a full quarter of pandemic effects, earnings could fall even further. The current domestic turmoil could add to the number of small businesses that determine not to reopen after the pandemic subsides.
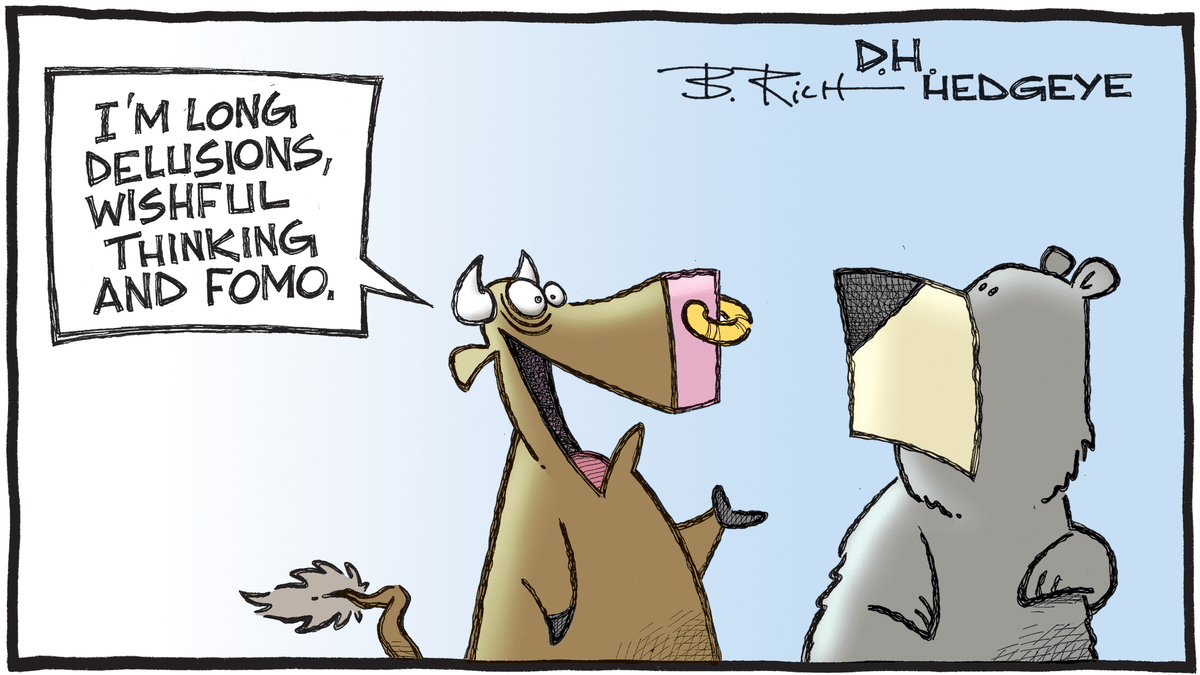
Beginning in February, these forces pushed the stock market into a bear market, with the S&P 500 tumbling 34% and the Russell 2000 small cap index nosediving 42% by around March 23. Then, the Fed jumped-in to try and save the day by creating record amounts of money in the shortest amount of time. These funds are used to either create or purchase debt. The long-standing doomed-to-fail tradition of using debt to solve a debt problem continues. However, this massive injection of liquidity initiated a strong bear-market rally recouping about 70% of the previous losses and instilling FOMO (Fear Of Missing Out) among investors. More importantly, this, along with a lot of cheerleading, has caused some to believe the economy will simply bounce back by the end of the year. Apparently, certain pundits do not believe long-term damage to corporate earnings has occurred. Or, they simply think earnings no longer matter and the Fed will create enough money to keep the market permanently high, even as the economy and earnings are sliced in half or more.
The results can be seen in Warren Buffett’s favorite valuation metric, market cap-to-GDP. The chart of this measure below shows the stock market is at the second highest valuation in history. If post-second quarter GDP were used in this calculation, the market would easily be the most overpriced market in the history of the stock market.

With all of that said, how should one navigate these markets? In addition to the dislocation between stock markets and the economy, mixed messages are emanating between the stock and bond markets. Stock markets are, in my opinion, giving the “all-clear” message, while the bond market is filled with trepidation. Historically, the bond market has been a better gauge of reality. The 10-year Treasury yield has fallen from 3% at the end of 2018,(when most pundits were proclaiming it would soar to 4% or above, while I stated rates would continue to fall) to about 2% at the beginning of 2020, to 0.66% currently. Long-term Treasury yields tend to track economic growth and inflation. The bond market is warning of low economic growth and deflation.
It is important to remember investment guru Bob Farrell’s rule number 8, from his 10 Market Rules to Remember. Rule 8: Bear markets have three stages – sharp down (Feb-March 2020), reflexive rebound (April – present), and a drawn-out fundamental downtrend (still to come).
The key to investing in these turbulent markets is understanding where the market is in its cycle. In order to hold stocks or equity investments in the middle of a bear market, one must either: (1) be prepared to hold for the long-term, suffer the consequences of the potential upcoming losses and “hope” the market rebounds as it has during the past two bear market cycles; or (2) have a strategy to actively manage the portfolio and feel confident his/her strategy will provide a signal as to when to either sell or “short” the market.
When examining these options for stockholders, it is important to study stock market history. Most investors do not remember the long-periods of stock market undervaluation or stated another way – lack of bounce back after a bear market. Such periods occurred in the 1930-40’s and in the 1970’s. Since the U.S. seems to be following in the footsteps of Japan, in terms of government debt and money creation, it is important to note the Nikkei 225 Index remains 44% below its 1989 peak. Imagine three decades without recouping losses. This lack of bounce back is possible in the U.S.
If one is unwilling to hold through prolonged periods of losses, possibly a decade or more, or doesn’t have a defined strategy for actively managing market exposure throughout the market cycle and intermediate trends, then sitting out the current high-volatility, high-risk, market environment with safe conservative fixed income investments might be in order. Our investment strategy is an active strategy where we will attempt to profit from the deflation of bubbles, and trade as appropriate based upon the market cycle and intermediate trends.
Often investors become discouraged when 10-year Treasury Notes are yielding only 0.66% annually. However, we do not invest in Treasury Notes for the yield. When interest rates fall, the price of Treasury Notes rises. The amount of gain per one percent drop in interest rates is determined by its duration. Duration is a different concept than maturity. For instance, the duration on the SPDR Long-Term Treasury exchange traded fund is 19.33 according to Morningstar. That means the price of the fund will rise 19.33% for every 1% drop in Treasury rates. And, the inverse is true for rising rates. Therefore, we attempt to profit from falling interest rates as well as movements in stock prices.
When the VIX (Volatility Index) is close to 30, one can expect large, quick movements in stock prices, with significant downside risk. A VIX under 12 is considered low, over 20 is considered high, and in between are more normal ranges. The stock market has exhibited a VIX over 25 since the turmoil in markets began at the end of February. The current VIX is over 28 and could easily jump above 30 in a day.
When the stock market is rising at the same time the economy is being cut in half, a fourth of the labor force is unemployed, a pandemic continues, civil unrest is rising, corporate profits are expected to continue falling, and 10-year Treasury Notes are yielding only 0.66%, one might want to minimize risk to equities, unless one can answer “yes” to one of the two conditions mentioned above. One would be wise to avoid FOMO!

The S&P 500 Index closed at 3,044 up 3% for the week. The yield on the 10-year Treasury Note fell to 0.64%. Oil prices increased to $35 per barrel, and the national average price of gasoline according to AAA rose to $1.98 per gallon.
© 2020. This material was prepared by Bob Cremerius, CPA/PFS, of Prudent Financial, and does not necessarily represent the views of other presenting parties, nor their affiliates. This information should not be construed as investment, tax or legal advice. Past performance is not indicative of future performance. An index is unmanaged and one cannot invest directly in an index. Actual results, performance or achievements may differ materially from those expressed or implied. All information is believed to be from reliable sources; however we make no representation as to its completeness or accuracy.
Securities offered through First Heartland Capital, Inc., Member FINRA & SIPC. | Advisory Services offered through First Heartland Consultants, Inc. Prudent Financial is not affiliated with First Heartland Capital, Inc.

