Executive Summary
Many people are asking why the market is not dropping. After all, the economy has been shut down for almost two months! According to CNBC on Monday, the reason of the day for the market surge was news from Moderna of positive results of a possible COVID-19 vaccine. However, the details make such justification ludicrous. The results were for a Phase 1 trial of only 45 people. Reviewing recent economic data validates the head-scratching related to current market movements. Last Friday, the Atlanta Fed released their GDPNow 2nd quarter estimate of economic growth, and the number plunged to an unbelievable -42.8%. The first three paragraphs in The Details clearly show the huge drop in three of the main components in the GDP growth calculation: retail sales, industrial production, and employment. It turns out the Federal Reserve Bank Chairman, Jerome Powell, revealed the answer in his interview on the television program 60 Minute this past Sunday. Please proceed The Details for quotes from the interview, and for an overall discussion of the disconnect.
“If you put the Federal Government in charge of the Sahara Desert, in five years there’d be a shortage of sand.”
— Milton Friedman
The Details
This might appear to be a simple question. However, current market movements highlight the absurdity of the disconnect. The stock market should be a reflection of the economy. The key word here being “should.” Today, Monday, May 18, the stock market ramped up in early morning futures trading before regular trading hours. The gap-up helped all day, and as usual financial media had the reason for the market surge. CNBC reported early this morning that Moderna reported favorable results from a Phase 1 trial for a COVID-19 vaccine in a test of 45 people! I kid you not. A Phase 1 early test on a mere 45 people, and this caused a market ramp of 3-4%. But what really caused the market to rise? Let’s review some of last week’s economic data to see if it supports such a movement.
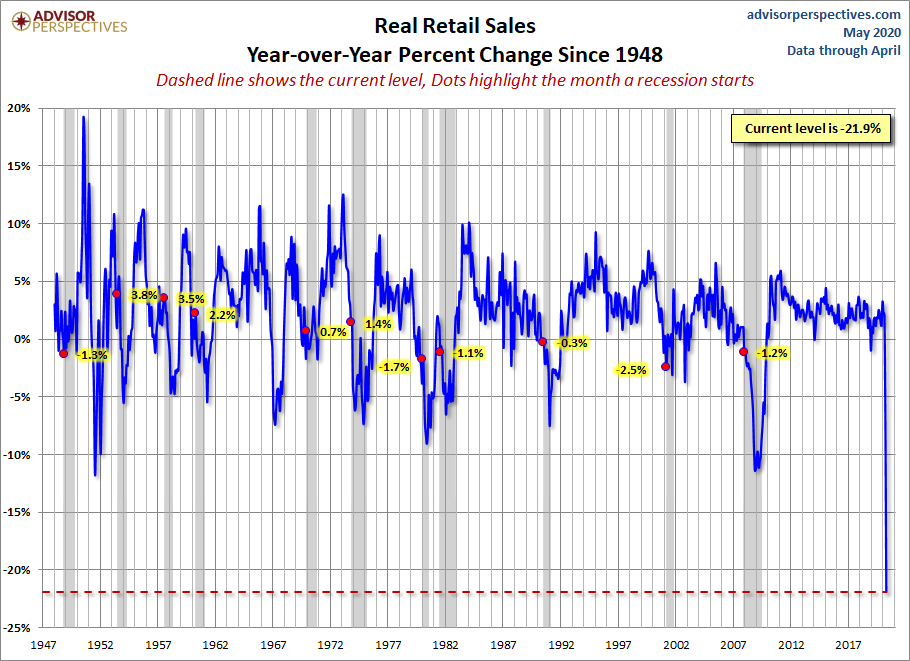
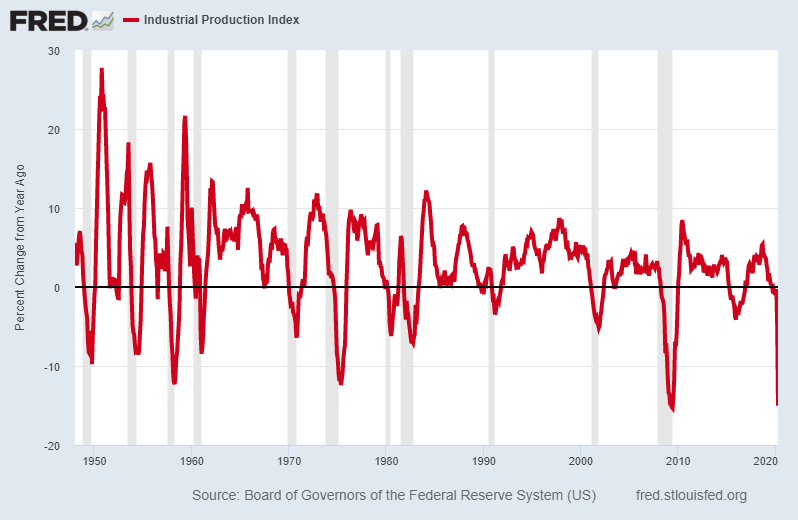
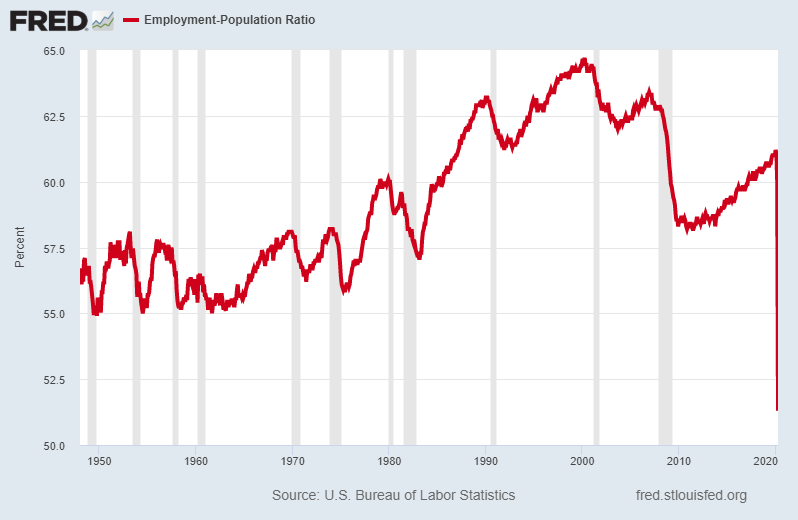
Last Friday, the Atlanta Fed released their GDPNow 2nd quarter estimate of economic growth, and the number plunged to an unbelievable -42.8%. Three of the major components used to calculate GDP growth include retail sales, industrial production and employment. Let’s look at a chart of each one and see if it indicates a reason why the stock market might jump.
First up is a chart of retail sales prepared by Advisor Perspectives. Notice that the current plunge in real retail sales far exceeds any previous downturn since 1948 including 11 prior recessions.
Next a look at industrial production prepared from the St. Louis Federal Reserve FRED database. Again, the plummet in industrial production exceeds the start of the previous 11 recessions.
And finally, the employment picture. The best indicator for employment is the employment-to-population ratio. This graph illustrates the percentage of eligible working age individuals who are employed. This chart, also prepared from the St. Louis Fed FRED database, shows employment as a percentage of the population fell far below any of the prior 11 recessions.
So, if the data is clearly not indicating a recovering economy, the market surge must be based purely on a whole lot of hopium for a quick rebound in the economy. As time rolls on, the expectations for a quick bounce back are fading. Unfortunately, many businesses will be forced to close permanently, and a number of large corporations have filed for bankruptcy. The number of layoffs will continue to soar. Piling debt on top of a mountain of debt is the solution of choice by the policymakers. This will not end well for those being sucked into the most overvalued stock market in history under the guise the economy will magically bounce back (to the already tepid pre-COVID-19 growth rates).
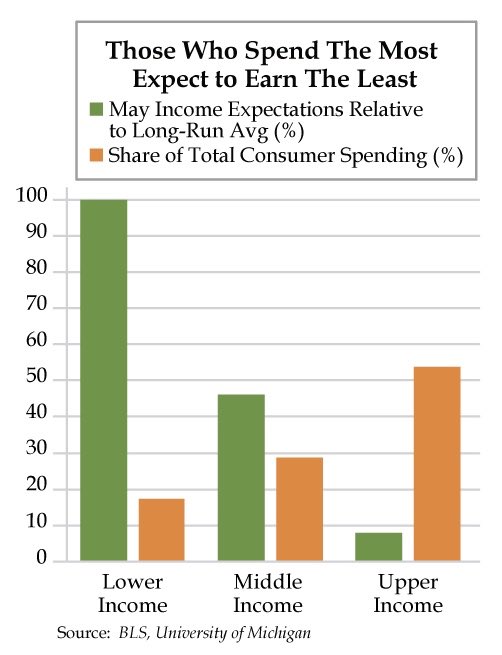
The majority of economic growth is derived from consumption. Of course, over the past few decades this consumption was only possible through increased borrowing. If incomes fall, will debt-financed consumption be possible? The chart below shows the individuals who consume the most are the ones with the greatest loss in income. This does not bode well for expectations for increased consumer spending.
If the economic data and expectations don’t account for the market surge, what does? Last Sunday, Federal Reserve Bank Chairman, Jerome Powell appeared on the show 60 Minutes. The following excerpt reveals the answer.
Powell to Pelley: “There is NO LIMIT to what we can do under these emergency powers.”
Pelley: “Where does the money come from?”
Powell: “We print it digitally.”
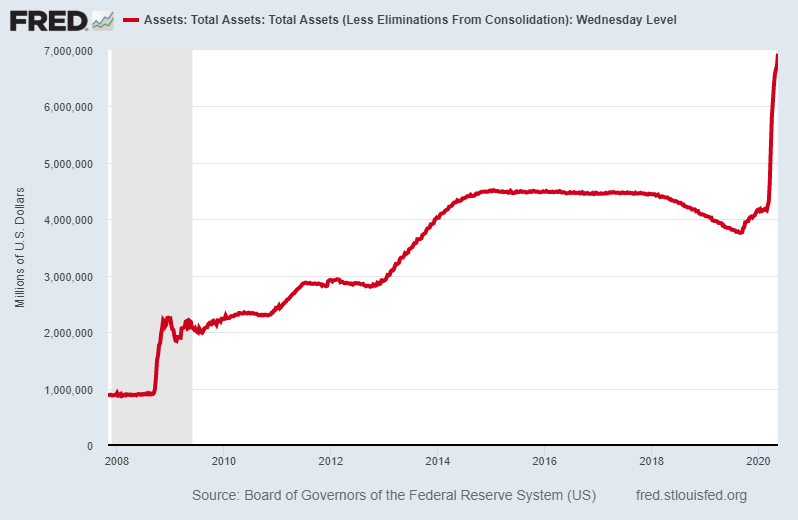
The following graph of the Fed’s balance sheet is stunning. Prior to the Financial Crisis in 2007, the Fed maintained under $900 billion in assets. To the shock of many, they massively (or so I thought at the time) increased their assets through a number of Quantitative Easing programs to a whopping $4.5 trillion. The recent surge to just under $7 trillion, makes the last program seem trivial.
The following exchange sums up the insanity exuding from the Fed.
Pelley: “Fair to say you simply flooded the system with money?”
Powell: “Yes. We did. That’s another way to think about it. We did.”
Pelly: “Where does it come from? Do you just print it?”
Powell: “We print it digitally…”
Investors are obviously confused by the dichotomy of a crashing economy and strong market bounces. The annual Federal deficit is projected by the CBO at $3.7 trillion, but that was before talk of another stimulus bill. The House passed a new $3 trillion stimulus package last week. While it is likely to fail in its existing form, any further stimulus will continue to push the deficit to unheard of levels.
To believe the economy will be able to sustain such debt levels, absent massive defaults and/or hyperinflation, seems a little ludicrous. Those invested in stocks must understand the amount of risk embedded in today’s markets. Once sentiment changes as investors realize the unsettling economic picture and begin to shun risk, the market drop needed to bring valuations back in line with fundamentals is shocking. Based strictly on mathematics, an eventual plunge of at least 50% is likely. In the meantime, speculators will attempt to juggle high volatility, crashing economic data, and unreal amounts of money creation.
The stock market should not be inversely related to the economy.
The S&P 500 Index closed at 2,930 down 2.3% for the week. The yield on the 10-year Treasury Note fell to 0.64%. Oil prices increased to $29 per barrel, and the national average price of gasoline according to AAA rose to $1.88 per gallon.
© 2020. This material was prepared by Bob Cremerius, CPA/PFS, of Prudent Financial, and does not necessarily represent the views of other presenting parties, nor their affiliates. This information should not be construed as investment, tax or legal advice. Past performance is not indicative of future performance. An index is unmanaged and one cannot invest directly in an index. Actual results, performance or achievements may differ materially from those expressed or implied. All information is believed to be from reliable sources; however we make no representation as to its completeness or accuracy.
Securities offered through First Heartland Capital, Inc., Member FINRA & SIPC. | Advisory Services offered through First Heartland Consultants, Inc. Prudent Financial is not affiliated with First Heartland Capital, Inc.
