Executive Summary
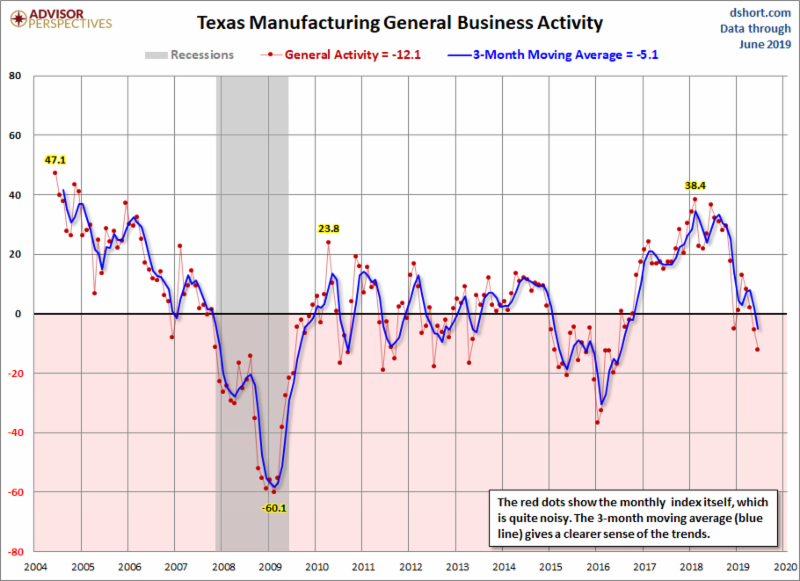
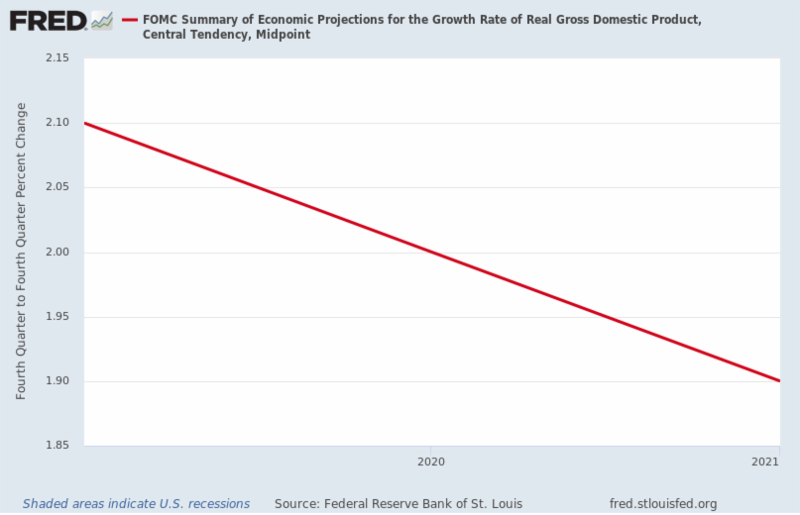
How should one read the economy and stock market? Should the market reflect the economy, or should the economy reflect what the stock market is doing? Corporate performance should be a reflection of the economy which then drives stock prices. However, in today’s world one often hears the stock market is escalating, thus the economy must be booming. In The Details are data from three different Federal Reserve regional manufacturing surveys which indicate falling economic conditions. Long-term real economic growth projections are around 1.9%. Historically, stock prices disconnected from economic fundamentals have resulted in bubbles. When bubbles have popped, investors have suffered. Please proceed to The Details to see what has been driving stock prices.
The Details
The “stock market” is a term used to represent the aggregate of stocks traded on a public stock exchange. Often broad-based indexes such as the S&P 500, Russell 2000 or New York Stock Exchange Composite Index are used as a proxy for the “stock market.” The “price” of the index is calculated from its individual components. Historically, a far-reaching index comprised of many companies would divulge some indication of where the economy was heading. Unfortunately, over the past decade and possibly longer, attempted manipulation of the “stock market” by overzealous central bankers has reduced or even eliminated “price discovery” in the markets.
The price of an individual corporation’s stock should represent the present value of a very long-term stream of cash flows, not merely the anticipated next three months. If accurately determined, the aggregate of corporations’ expected long-term cash flows would be dependent upon the expected future economic cycle. Many financial pundits have it backwards. They believe the economy is a reflection of what the stock market is doing. In reality, the stock market – if true price discovery exists – should provide a reflection of the economy.
Anyone who has followed the daily or weekly gyrations of the stock market lately has seen how the movements are spurred by speculation of central bank activity or hoped-for tariff agreements, no matter how realistic. Never mind whether a 0.25% decrease in the short-term Federal Funds Rate is actually going to impact the economic cycle, the stock market reacts. Over time, as these market price movements compound on “rumors” and “hopes,” stock prices become more disconnected from the underlying fundamentals in the economy. It is the re-awakening and realization of this disconnect that will eventually send stock prices plunging back to more fundamental-based prices. As central bankers have engaged in more extreme experimental monetary policy, the disconnect has grown larger pushing stock prices into bubble territory. The popping of prior bubbles has wreaked havoc on investors lured further into stocks by pundits, central bankers and politicians proclaiming that everything in the economy is great and the market will soar forever.
Presently, the claim of economic euphoria is centered upon the reduction in the unemployment rate – which I discussed in last week’s Update. Additionally, many are fooled by last quarter’s one-time annualized real GDP growth report which was boosted by an incredibly ridiculous 0.6% inflation adjustment. Using a reasonable inflation adjustment, such as the CPI or the PCE which are used for other governmental adjustments, would have resulted in a GDP growth rate of close to 2.2% or in-line with the post-recession average growth rate.
Current economic projections for second quarter 2019 growth include 2.0% by the Atlanta Fed’s forecasting model and 1.39% from the New York Fed’s model. These are not exactly the soaring economic results being touted by many pundits of late. In fact, a closer look at current trends in the data reveal the U.S. could likely be in or close to a recession. For example, the recent Empire State Manufacturing Survey, which reveals the general business conditions in New York state, declined 26 points to -8.6. This is the largest one-month decline on record. A negative number indicates worsening conditions.
The Philly Fed Manufacturing Index which covers eastern Pennsylvania, southern New Jersey, and Delaware plunged 16.3 points to just over zero at 0.3. These result “continue to reflect muted optimism for the remainder of the year.” And finally, the Dallas Fed’s Texas Manufacturing Outlook Survey stated, “The general business activity index pushed further into negative territory as more firms noted worsened activity this month than last.”

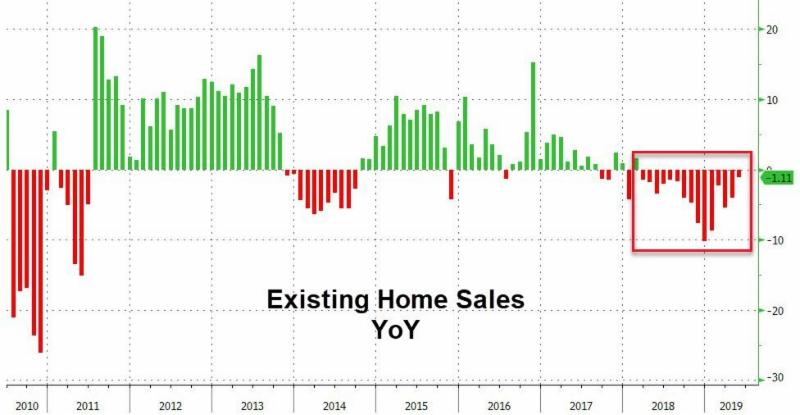
Furthermore, home sales have turned downward. Existing home sales have fallen on a year-over-year basis for the past 15 consecutive months. See graph below from Zero Hedge


With stock prices already over double their long-term mean valuation, only a massive surge in long-term corporate earnings could justify such prices. Yet, with long-term economic growth projections falling to around 1.9%, it would be next to impossible for long-term earnings to reach levels needed to justify prices. And on a shorter-term basis, some research firms now expect second and third quarter 2019 earnings to be either flat or below prior year comparables.
If you read it backwards, the price of the “stock market” projects a booming economy. Unfortunately, the economic data does not support such a conclusion. When read properly, the stock market is grossly exaggerating expected economic growth. Historically, when this has occurred a major “reset” was forthcoming which re-joined prices to fundamentals. The previous two “resets” inflicted much pain on holders of bubble-priced stocks, will next time be any different?
The S&P 500 Index closed at 2,950, up 2.2% for the week. The yield on the 10-year Treasury fell to 2.07%. Oil prices jumped to $57 per barrel, and the national average price of gasoline according to AAA decreased to $2.66 per gallon.
At Prudent Financial, portfolios are developed to take into account the state of the economy, market cycle and valuation, and relative strength. Our goal is long-term growth with limited downside potential. If you need assistance with your portfolio, please give me a call. I would be happy to review your situation and explain how we can help you work towards achieving your goals.
© 2019. This material was prepared by Bob Cremerius, CPA/PFS, of Prudent Financial, and does not necessarily represent the views of other presenting parties, nor their affiliates. This information should not be construed as investment, tax or legal advice. Past performance is not indicative of future performance. An index is unmanaged and one cannot invest directly in an index. Actual results, performance or achievements may differ materially from those expressed or implied. All information is believed to be from reliable sources; however we make no representation as to its completeness or accuracy.
Securities offered through First Heartland Capital, Inc., Member FINRA & SIPC. | Advisory Services offered through First Heartland Consultants, Inc. Prudent Financial is not affiliated with First Heartland Capital, Inc.
Want to learn more about our Insurance strategies?
Set up a time to chat with us.

