Executive Summary
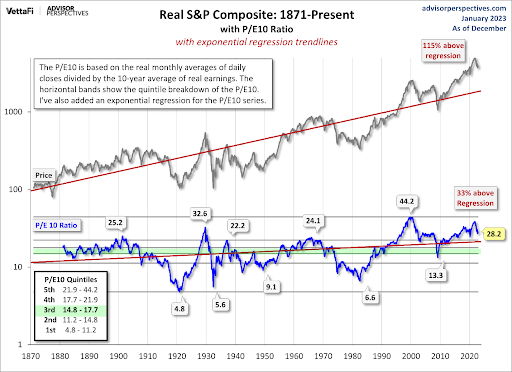
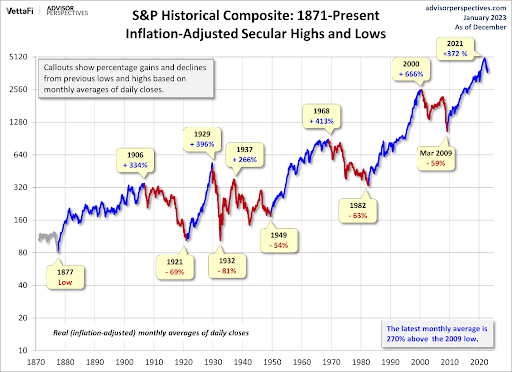
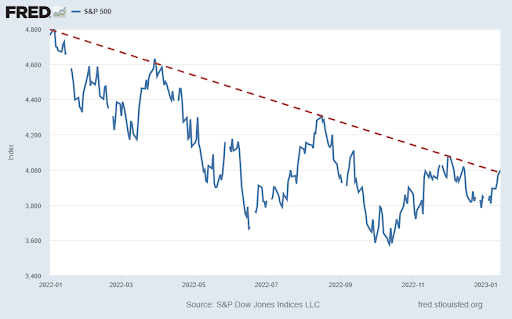
Stock markets move in long-term (secular) and shorter-term (cyclical cycles). Historically, the Shiller Price-to-Earnings (P/E) ratio could be used to define secular cycles. In the first graph below, one can see secular bull markets tend to start in single-digit Shiller P/E ratios and end in the 5th quintile (21-42). However, over the past few decades, the Federal Reserve Bank (Fed) used unprecedented monetary policy (extremely low-interest rates and quantitative easing) in attempts to control the economy and the stock market. As a result, the Tech Bubble and the Financial Crisis did not result in single-digit Shiller P/E ratios. During the secular cycle beginning in March 2009, the Fed created the most overvalued stock market bubble (see 2nd graph). Even after the 2022 market correction, the Shiller P/E is still around 29. Investors appear to be ignoring economic warning signs even with the stock market trending downward (see last graph). Will this bear market result in a single-digit Shiller P/E ratio, and set up the next secular bull market?
Please continue to The Details for more of my analysis.
“Good judgment comes from experience, and a lot of that comes from bad judgment.”
–Will Rogers
The Details
The stock market moves in cycles. Long-term cycles are called “secular” bull or bear markets after the Latin saeculum meaning “a long period of time.” Secular cycles vary in length but tend to last from years to decades. Shorter cycles are referred to as “cyclical” bull or bear markets. These cycles last from months to years. There can be multiple cyclical cycles in a secular cycle.
Historically, the Shiller Price-to-Earnings (P/E) ratio could be used to define secular cycles. The Shiller P/E, sometimes referred to as the PE10 or Cyclically Adjusted P/E (CAPE), is calculated by dividing the market price by 10-year inflation-adjusted earnings. This removes the shorter-term fluctuations attributable to the business cycle. The current Shiller P/E is a little over 29. The long-term median is about 16. Historically, secular bull markets tended to peak when the Shiller P/E reached the fifth quintile as shown in the graph below from Advisor Perspectives. Secular bear markets would burn off these extreme valuations and would typically end when the Shiller P/E reached single digits in the first quintile.

Over the past few decades, the Federal Reserve Bank (Fed) aggressively used monetary policy in attempts to control the economy and the stock market. Former Fed Chairman Ben Bernanke even admitted as much when he discussed a desire to create a “wealth effect” to support the economy. He was indicating that by implementing extreme monetary policies, the stock market would rise which would create increased wealth that would be spent to boost economic growth. Notice in the graph above, the Shiller P/E peak during the Technology Bubble (2000) was much larger than even the lead up to the Great Depression. And although recent Shiller P/E levels have not reached the height of the Technology Bubble, when adjusted for fluctuations in profit margins, current valuations remain higher than the Technology Bubble peak.
Also note, since the mid-1990’s the Fed has been able to prop up market valuations, keeping the Shiller P/E above the median for almost the entire period. Even the massive market sell-offs during the Technology Bubble, the Financial Crisis, and the Pandemic did not reduce the Shiller P/E to single-digit levels as seen in all past secular bear markets. The closest it came was during the Financial Crisis when the Shiller P/E briefly dropped to around 13, before Fed policies were able to reinflate valuations.
The graph below highlights secular cycles using the inflation-adjusted S&P 500 Index. Notice that through unprecedented monetary policy (extremely low-interest rates and quantitative easing), the Fed was able to create the most overvalued stock market bubble during the secular cycle beginning in March 2009.

The secular bull market beginning in March 2009 might have ended in December 2021. Afraid they had allowed inflation to run out of control, the Fed began aggressively reversing policy by raising short-term interest rates and implementing quantitative tightening – which is effectively the opposite of QE. These policies, combined with high inflation and fear of recession, pushed some investors to sell, dropping the S&P 500 by about 19% last year. Is this the start of a new secular bear market, or will the Fed “pivot” back to loose policies to save the market? The Fed has painted themselves into a corner. If they pivot to save markets, they risk a resurgence in inflation. If they maintain tight policies, they risk the market continuing to drop.
Besides reaching a single digit Shiller P/E, another way to know when a secular bear market has ended is when investors do not want anything to do with stocks. Usually, the pain of a secular bear market was so great that the vast majority of investors would have capitulated and expressed no interest in buying back into the stock market. Looking at today’s stock market, it is obvious that investors are nowhere close to that point. Investors continue to hope for a Fed pivot and are buying stocks on every dip. If this truly is the start of a secular bear market, that type of mentality will cause extreme pain for a lot of investors. In the meantime, short-term bear market rallies continue to pull in those hoping to catch the next wave higher. Some refer to this as trying to catch a falling knife. Unfortunately, as outlined in last week’s missive, corporate earnings are falling, and recession fears linger. Investors seem to be ignoring these warnings signs at the moment; however, the economic data is weakening, and corporations are beginning to show signs of difficulty. And the stock market continues to trend downward.

The Fed has obfuscated secular bear markets with unprecedented policies. Unfortunately, the consequences of their actions are finally being observed in the economy. Inflation soared and debt levels are extreme. Will this be the secular bear market where the Shiller P/E returns to single digits? Although this would involve huge losses during the cycle, it would also create one of the best set-ups for the next secular bull market seen in decades.
The S&P 500 Index closed at 3,973, down 0.7% for the week. The yield on the 10-year Treasury Note fell to 3.48%. Oil prices increased to $82 per barrel, and the national average price of gasoline according to AAA rose to $3.42 per gallon.
© 2021. This material was prepared by Bob Cremerius, CPA/PFS, of Prudent Financial, and does not necessarily represent the views of other presenting parties, nor their affiliates. This information should not be construed as investment, tax or legal advice. Past performance is not indicative of future performance. An index is unmanaged and one cannot invest directly in an index. Actual results, performance or achievements may differ materially from those expressed or implied. All information is believed to be from reliable sources; however we make no representation as to its completeness or accuracy.
Securities offered through First Heartland Capital, Inc., Member FINRA & SIPC. | Advisory Services offered through First Heartland Consultants, Inc. Prudent Financial is not affiliated with First Heartland Capital, Inc.

