Executive Summary
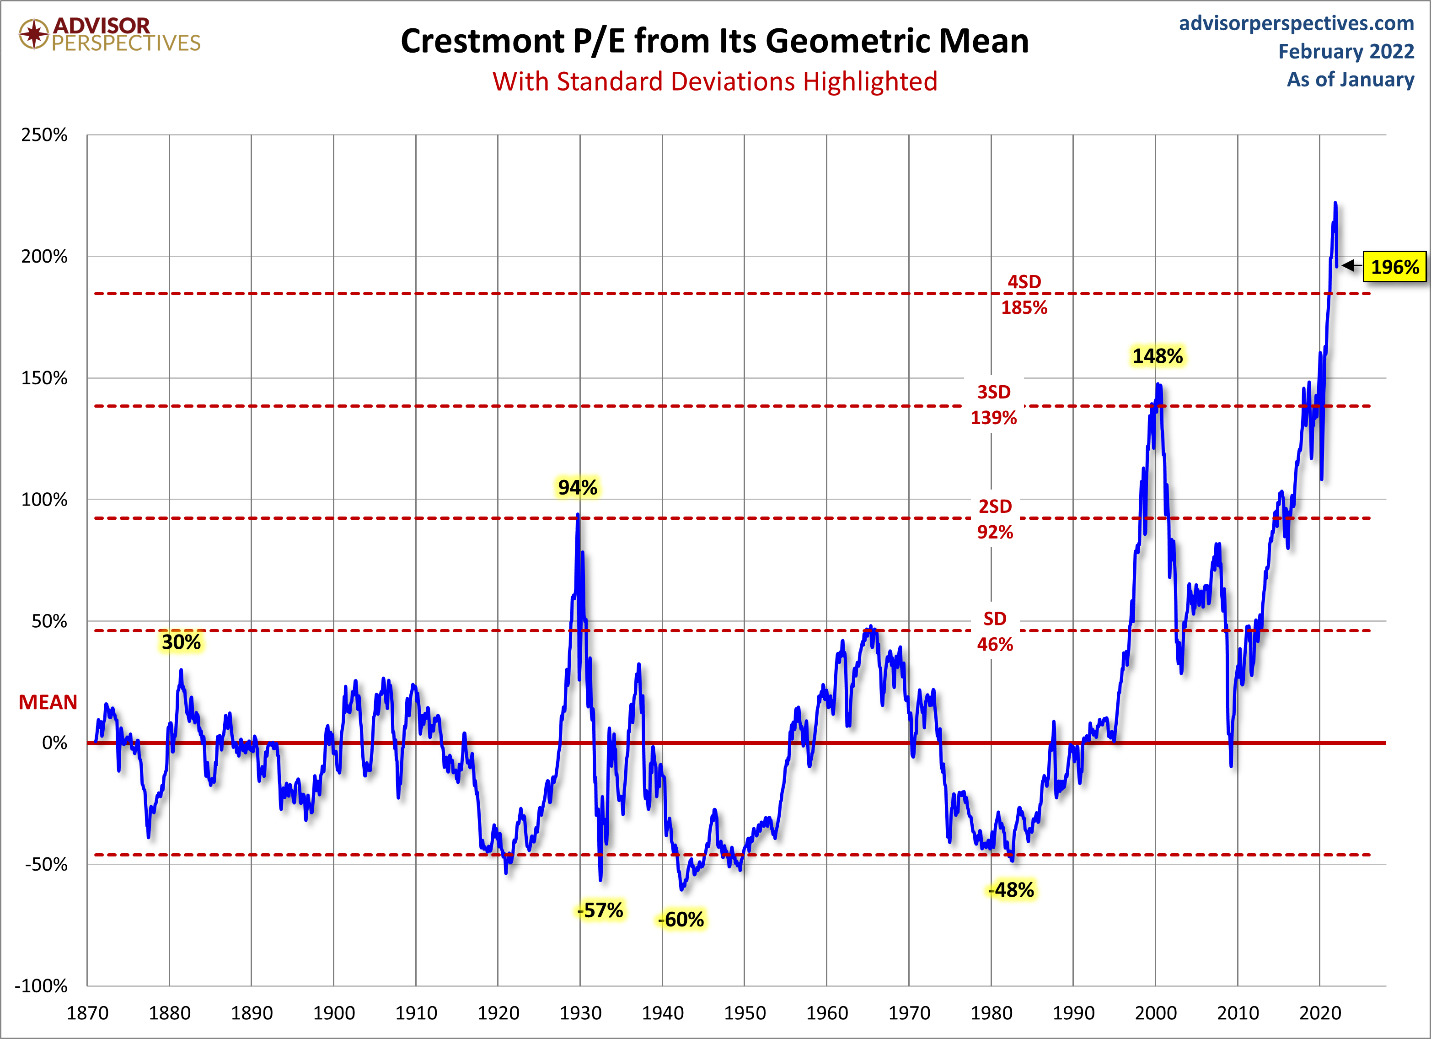
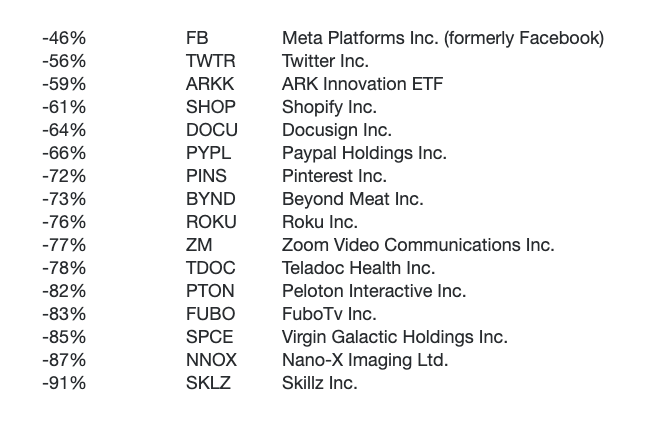
Multiple expansion means investors pay more per dollar of corporate earnings for a share of stock. The opposite would be the contraction or reduction in stock prices per dollar of corporate earnings. Multiple expansion results in overvaluation in stock prices from their long-term mean. One can see in the first graph below the significant overvaluation of stock prices. Historically each market cycle has both an up and downside. Stock leaders (oftentimes tech stocks) on the way up, typically become the loss leaders as well on the way down. (See list of stocks down more than 45% from their highs) With Fed policy tightening, geopolitical tensions surrounding Ukraine amplifying, and inflation persistently rising, the cycle could be turning – which may lead to multiple contraction. Time will tell.
Please proceed to The Details.
“Periods of depression invariably follow periods of overoptimism, when fear replaces hope as the controlling emotion.”
–Edwin Lefevre
The Details
Over the past 11+ years, the stock market has experienced almost continuous multiple expansion. Multiple expansion means investors, when purchasing stock, pay more per dollar of corporate earnings. Beginning in about April 2009, after the stock market bottomed and the Great Recession officially ended, prices began rising and multiples expanding. This cycle, more so than any previous one, was fueled by almost uninterrupted radical expansionary policies, both monetary and fiscal. These policies pushed stock valuations to levels beyond prior bubbles. Market cycles normally lead to prices far above what is considered reasonable for a certain level of revenue and earnings. Then the cycle turns, and prices fall. The concept behind “mean” or average long-term valuations rests on the fact that valuations will fluctuate both above and below the mean during a complete market cycle. Unfortunately, over the past 40 years, stock valuations have spent most of the time above the long-term mean, with a couple very brief exceptions.
Keeping stock prices high and rising has been one of the goals of the Federal Reserve Bank’s (Fed’s) monetary policy as described in last week’s missive. Over time, keeping valuations above long-term norms tends to “pull” the mean higher. This temporary – albeit longer than expected – action gives investors, turned speculators, confidence to buy stocks at unprecedented prices when compared to corporate revenue and the long-term earnings outlook.
The chart below from Advisor Perspectives illustrates the extreme level of valuations using the Crestmont P/E which is a derivation of the CAPE (Cyclically Adjusted P/E also known as the Shiller P/E).

As time passes during a stock market bubble, speculators tend to gravitate towards the riskiest stocks. These companies are often new technology-related companies, where price multiples are ignored because miracles are expected from these companies. Unfortunately for speculators, these are often the first companies to get destroyed once the cycle turns. Many speculators, convinced reduced prices mean the stocks are now a bargain, will keep buying these “hot” stocks as they drop. I watched this occur after the Technology Bubble burst (2000-2002). Many speculators continued buying all the way down to zero, as many companies ended up filing bankruptcy.
The Fed has now signaled at least three rate hikes this year (although the market is expecting more) and an end to QE (Quantitative Easing) come March 2022. This anticipated reversal in monetary policy is already impacting the stock market. Year-to-date, the S&P 500 is down 8.7%, the Russell 2000 smallcap index is down 10.5%, and the tech-heavy NASDAQ is down 13.4%. And that is before tightening policies have even started. On top of a change in monetary policy, the economy is slowing as inflation remains high. And, now there are significant geo-political concerns as Russia threatens to invade Ukraine, and Canada is cracking down on protestors even going so far as freezing bank accounts.
With all of that said, the first stocks to fall when a bubble begins to pop are the high-flying tech stocks. To provide a sampling of what has already occurred, even as valuations remain near record highs, the following is a just a small selection of companies which have seen their stock prices fall over 45% from recent highs.

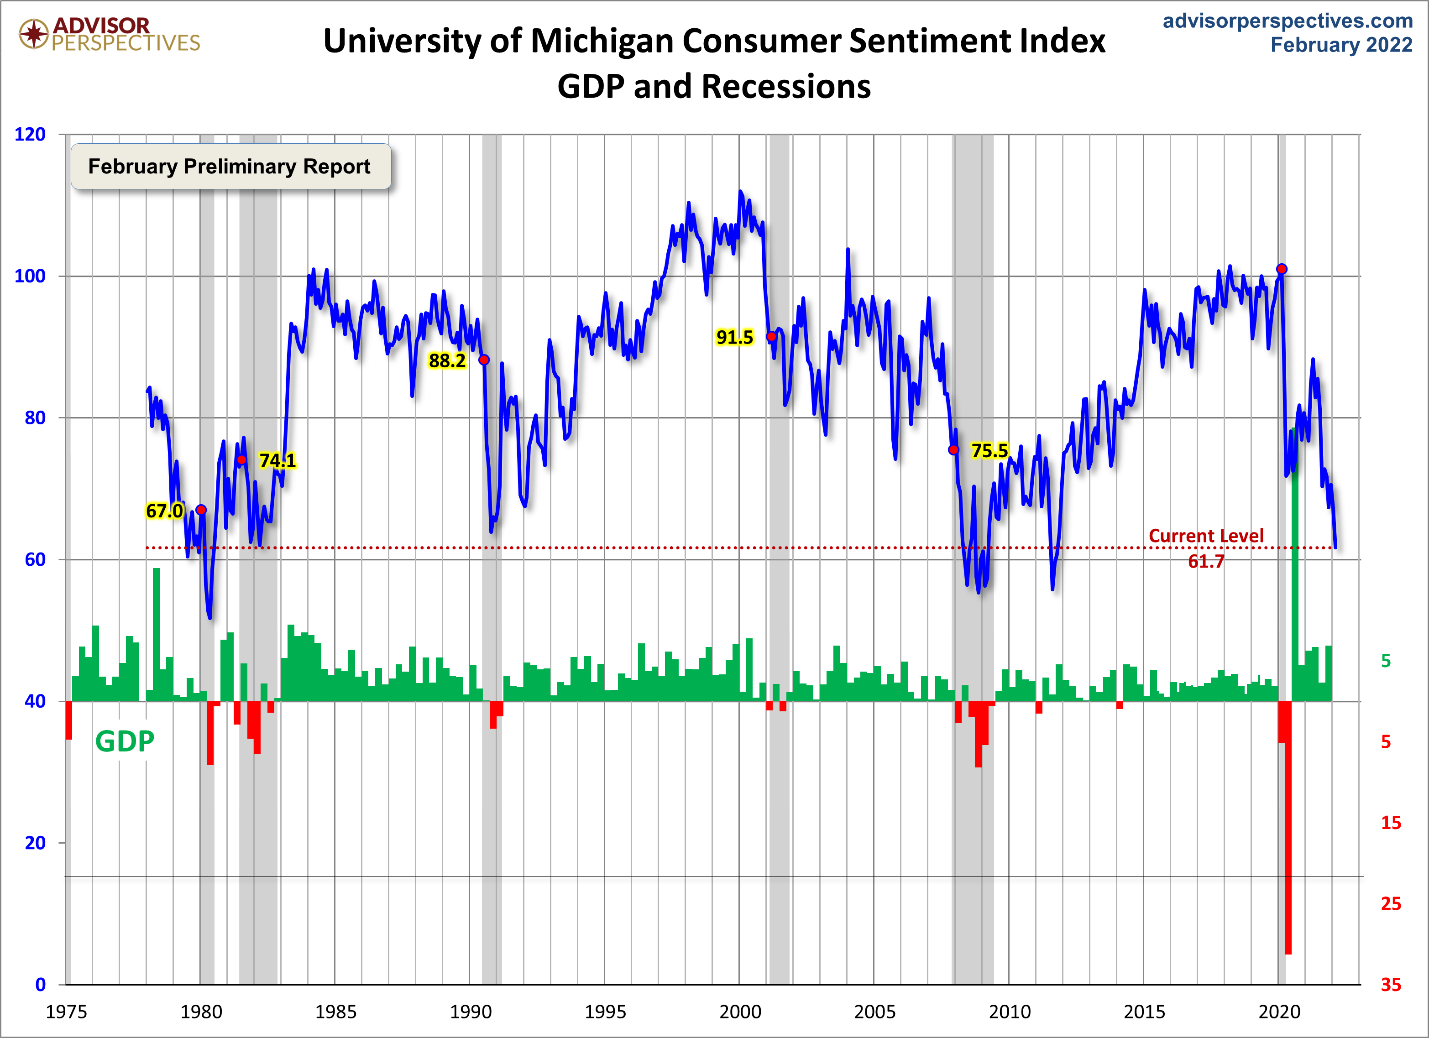
As the cycle turns, multiple expansion will turn into multiple contraction as prices and valuations fall. Those who have studied prior cycles might be wondering whether valuations will be allowed to fall below the mean, as they have in historical bear markets. Falling below the mean validates the mean and eliminates the mean “pull” higher. Or will the Fed jump back in and return to unprecedented expansionary policy in an attempt to push prices and valuations back up? And how long will investors remain confident that the Fed can continue to artificially inflate the stock market and the economy? Sentiment, as shown below, is already near levels normally seen well into recessions.

It appears the cycle is turning and the largest bubble in history could be deflated. This is still the very early stage and much depends upon what the Fed and the Federal Government do with monetary and fiscal policy, respectively. Even after the slight retracement seen recently by the stock market, a drop below “mean” valuation levels would require an additional reduction in stock prices of over 60%. If readers do not believe this is possible – and did not witness or participate in the post-Tech Bubble bear market – just look again at what has already occurred for the companies listed above.
At this time, multiple expansion appears to be turning into multiple contraction.
The S&P 500 Index closed at 4,349 down 1.6% for the week. The yield on the 10-year Treasury Note fell to 1.93%. Oil prices decreased to $92 per barrel, and the national average price of gasoline according to AAA rose to $3.53 per gallon.
© 2022. This material was prepared by Bob Cremerius, CPA/PFS, of Prudent Financial, and does not necessarily represent the views of other presenting parties, nor their affiliates. This information should not be construed as investment, tax or legal advice. Past performance is not indicative of future performance. An index is unmanaged and one cannot invest directly in an index. Actual results, performance or achievements may differ materially from those expressed or implied. All information is believed to be from reliable sources; however we make no representation as to its completeness or accuracy.
Securities offered through First Heartland Capital, Inc., Member FINRA & SIPC. | Advisory Services offered through First Heartland Consultants, Inc. Prudent Financial is not affiliated with First Heartland Capital, Inc.

