Executive Summary
In this week’s missive, I provide a bird’s-eye view of the economy via a number of graphs and visuals. First is a look at the drop in real annualized gross domestic product growth in the second quarter (-31.38%) along with the projected partial rebound in the third quarter. Second is the growing gap between the growth in the economy and the substantial rise in overall debt, which is a drag on economic growth. Following, the unemployment claims dwarf those seen in the 2008 Great Recession and remain higher than all pre-COVID levels. While retail sales, housing and autos dipped and have rebounded, one can see the declining long-term trend line in all three. And finally, the BIG GAP between the growth in S&P 500 price and the drop in corporate profit margins. It is easy to get caught up in the minutia of daily espoused data-points. However, doing so might lead one not to see the forest for the trees.
It is important to see a bird’s-eye view as shown in the graphs in The Details below.
“Always remember, a bird’s eye view is way different from a worm’s eye view, when in fact, they’re looking at the exact same thing.”
–Paula Peralejo
The Details
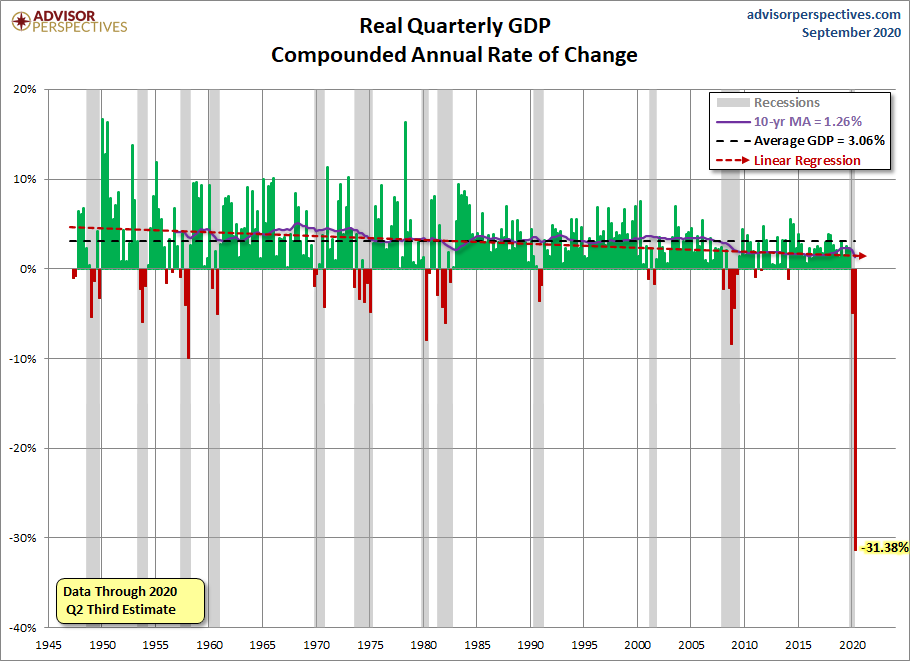
In a little over two weeks, the Bureau of Economic Analysis (BEA) will release the advance estimate of third quarter growth in real gross domestic product (GDP). The second quarter annualized growth rate plunged 31.4%, reflecting the full impact of locking-down the economy due to COVID-19. The third quarter saw many parts of the economy re-opening, albeit often at readings far below pre-pandemic levels. Many in the financial media are cheering what will likely be a large annualized jump in third quarter results. If the third quarter annualized growth rate (on a quarter-over-quarter basis) comes close to the 35% projected, many will think the economy has fully recovered. However, such a number would still leave the economy close to 7% below the pre-pandemic level. During the Great Recession, the economy never dropped more than 5%.
The very long-term trend in real GDP growth has averaged about 3%. As shown in the graph below from Advisor Perspectives, the prior 10-year average growth rate is 1.26%. The growth rates for fourth quarter 2020 and first quarter 2021 are estimated by Hedgeye Risk Management, LLC to be almost flat.
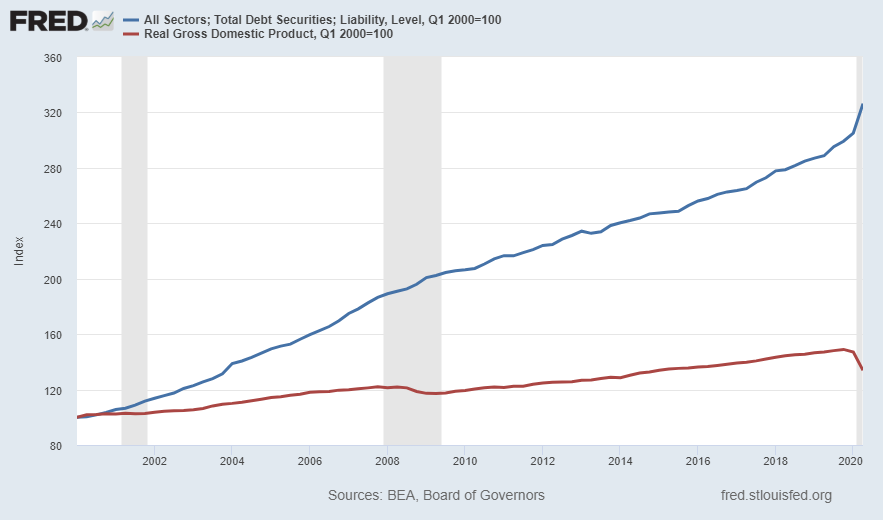
In addition to the COVID-19 crisis, the other main contributor to slowing long-term economic growth is the rising rate of debt accumulation. The graph below compares the rate of growth of all-sectors debt (blue line) versus growth in the economy (red line). Notice the widening gap as well as the recent spike higher in debt and plunge in GDP growth.
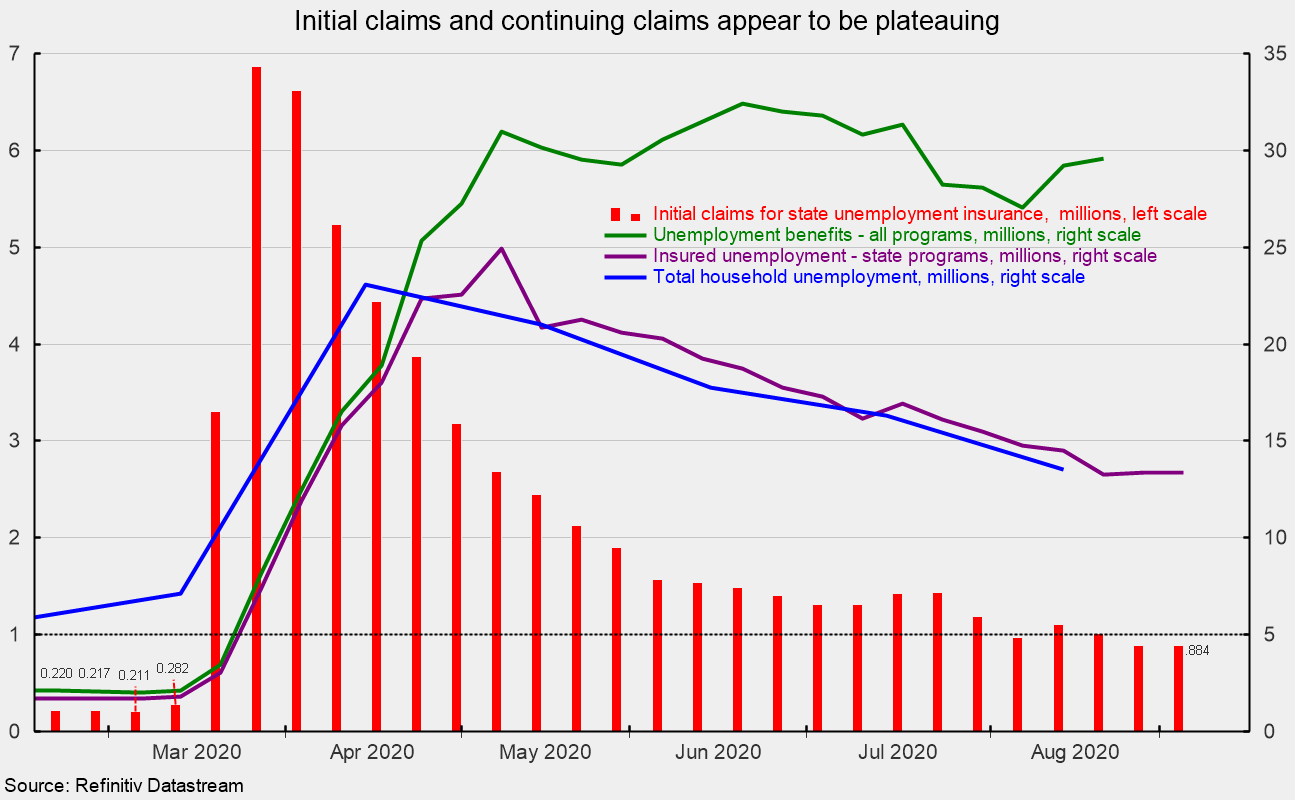
One of the most significant challenges during this environment has been the loss of jobs and replacement of earned income with unemployment benefits. Before the pandemic, the highest level of weekly first-time unemployment claims was 695,000. Since the start of the pandemic, initial weekly unemployment claims have exceeded the prior record level every week for over six months. The level of new weekly claimants appears to have plateaued around 840,000, well above the highest ever pre-COVID level. Additionally, total ongoing recipients of unemployment benefits, shown in the green line below, is a little under 30 million. A drop in recipients represents a combination of those acquiring new jobs and those whose unemployment benefits have expired.
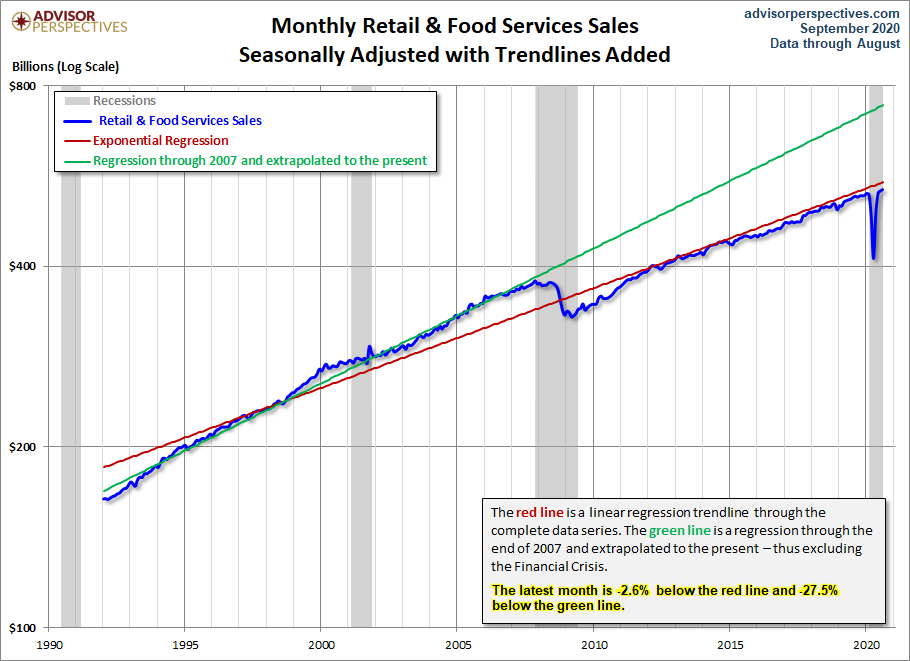
Another way to visualize the long-term slowing of GDP growth is by examining retail sales. The graph below from Advisor Perspectives illustrates how the trend in retail sales growth shifted lower after the Great Recession and has been growing at a slower pace ever since. Notice the former trend (green line) with the new slower growth trend (red line). The current level is about 27.5% below the previous trend. The accumulation of debt is weighing on growth.
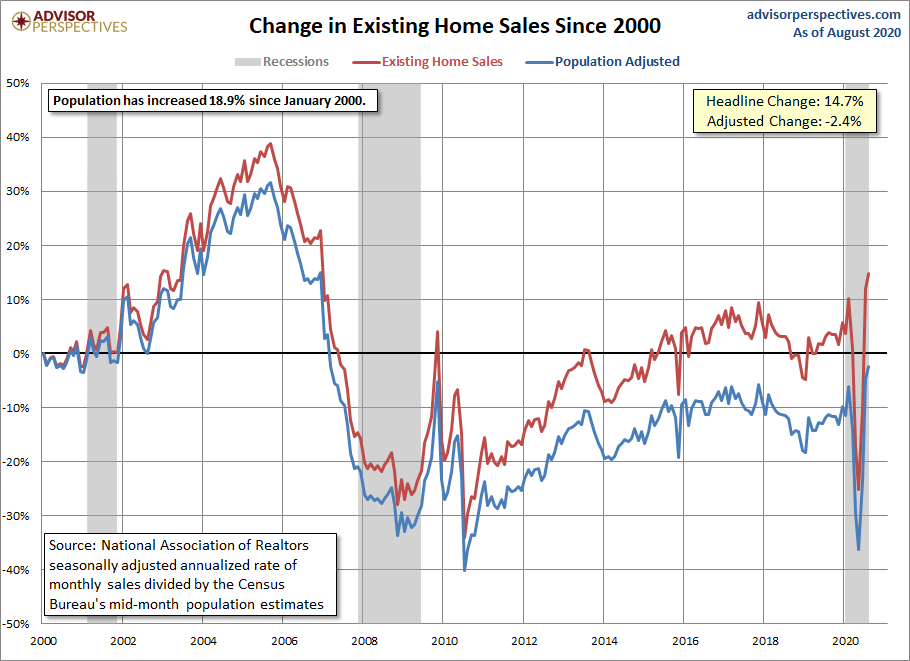
Although record low mortgage interest rates have spurred home-buying, the population-adjusted level of existing homes sold remains 2.4% below the level sold in 2000.
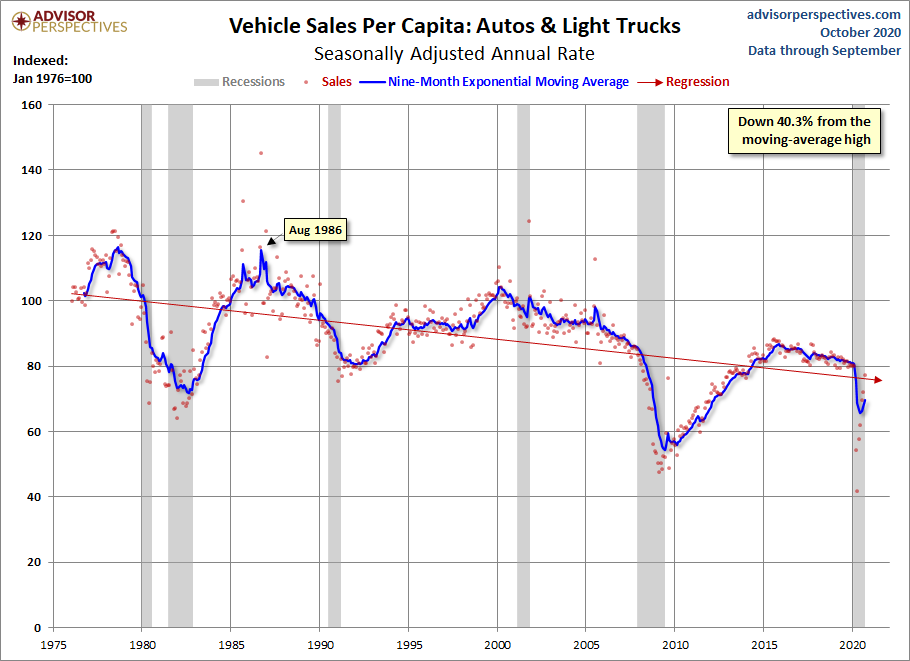
Low interest rates have also helped car buyers finance new purchases at record low rates. On the other side, as more families face permanent unemployment, the pace of car purchases will slow. Notice in the graph below that on a per-capita (population adjusted) basis, vehicle sales have been in a downtrend for decades. Presently, they remain just above the lows seen during the Great Recession.
And despite the data shown above, the stock market has continued its bounce based solely on hopes for more stimulus funds. While at the same time, corporate profits plunge.

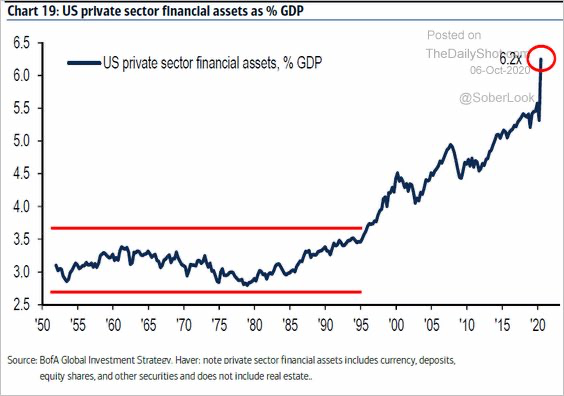
The record bubble in stock prices and other financial assets has pushed financial assets as a percentage of GDP to heights double that seen in 1950. See the graph below.
It is easy to get caught up in the minutia of daily espoused data-points. However, doing so might lead one not to see the forest for the trees. The charts above were provided to put the short-term data in perspective with long-term trends. A short-term stimulus package might push the stock market higher, provide a brief surge in retail sales, and allow tenants to go into forbearance on their rents; however, at the same time debt is accumulating creating an even greater barrier to long-term recovery. There is no amount of Federal stimulus that will boost the economy to sustainable prior-trend levels without first addressing the outstanding debt.
The S&P 500 Index closed at 3,477 up 3.8% for the week. The yield on the 10-year Treasury Note rose to 0.77%. Oil prices increased to $41 per barrel, and the national average price of gasoline according to AAA remained at $2.19 per gallon.
© 2020. This material was prepared by Bob Cremerius, CPA/PFS, of Prudent Financial, and does not necessarily represent the views of other presenting parties, nor their affiliates. This information should not be construed as investment, tax or legal advice. Past performance is not indicative of future performance. An index is unmanaged and one cannot invest directly in an index. Actual results, performance or achievements may differ materially from those expressed or implied. All information is believed to be from reliable sources; however we make no representation as to its completeness or accuracy.
Securities offered through First Heartland Capital, Inc., Member FINRA & SIPC. | Advisory Services offered through First Heartland Consultants, Inc. Prudent Financial is not affiliated with First Heartland Capital, Inc.

