Executive Summary
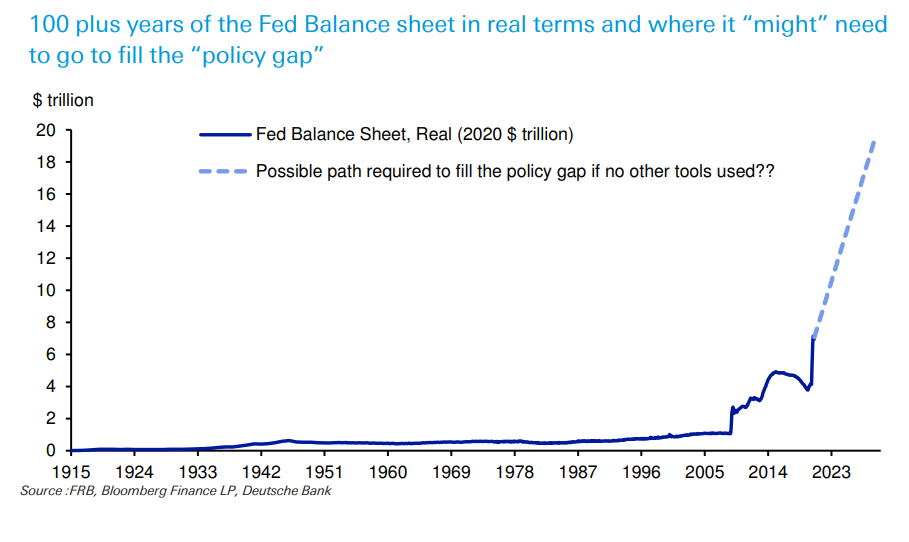
An excerpt from Investopedia’s definition of the free market is: “an economic system based on supply and demand with little or no government control.” In looking at the current situation, one will see how much Federal Reserve Bank (Fed) action and Federal government transfer payments are impacting markets. The Fed balance sheet has gone nearly vertical (see first graph) and is projected to continue in that direction. And now the actions are not limited to Treasuries, but they are also purchasing corporate bonds, including high yield or junk bonds. As a result, high yield bond markets are not yet reflecting the rapid increase in corporate bankruptcies. Stock market highs are also not reflecting the fact that GDP dropped almost 33% (annualized) in the second quarter. Economic growth in the U.S. is predominantly a result of personal consumption which is dropping. (Third graph below) Even with the amount of Federal government transfer payments from stimulus programs rapidly increasing, almost 40% of renters are facing evictions.
In The Details, one will find the explanation and picture of how current markets are distorted and do not appear to be “free markets” as defined by Investopedia.
“Underlying most arguments against the free market is a lack of belief in freedom itself.”
–Milton Friedman
The Details
Investopedia defines the free market as: “an economic system based on supply and demand with little or no government control. It is a summary description of all voluntary exchanges that take place in a given economic environment. Free markets are characterized by a spontaneous and decentralized order of arrangements through which individuals make economic decisions.” Reading this definition, it seems apparent that the U.S. and global markets have strayed from free markets.
During the Financial Crisis, Federal Reserve Chairman Ben Bernanke stated that the actions of the Fed were partly designed to create a wealth effect. In other words, the Fed knew that their policies would boost asset prices, and they hoped the additional wealth would be a boon to the economy. What they did not seem to understand was the benefit of such wealth would mostly advantage the upper income group and widen the wealth gap.
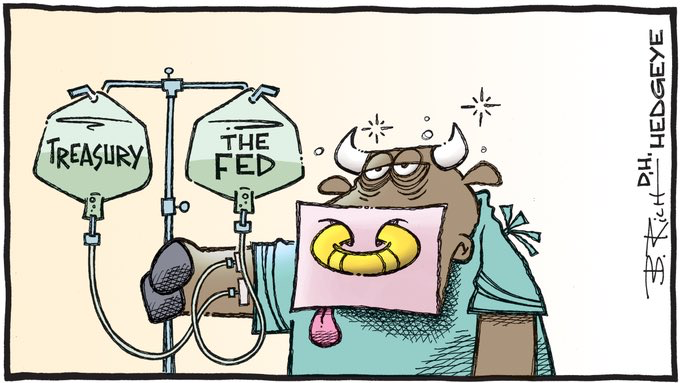
Direct involvement in the Treasury securities markets through various quantitative easing programs began chipping away at the free market. Now, the Fed has engulfed the bond market with purchases not only of Treasuries but also corporate bonds, exchange traded bond funds, and even high yield or junk bonds. Much of the liquidity provided by these operations, assisted by extremely low interest rates, has found its way into the equity markets creating the largest speculative equity bubble in history.
Over the six-year period from 2008 through 2014, the Fed balance sheet increased from about $900 billion to $4.5 trillion. Observers like me were shocked at the extent of the growth of electronically printed money, most of which ended up in the equity markets. Although the Fed stated the intent was to return the balance sheet to “normal” levels once the economy recovered, it became apparent as the economy began weakening that such reduction would not occur. In fact, not only did it not occur, but with the arrival of the COVID-19 related effects, it soared at a rate which many thought unfathomable. The increase became a near vertical line (see graph below) with a surge of almost $3 trillion in about three months! This might only be the beginning. The Fed has indicated they are willing to do whatever it takes to fight the current state of recession. With COVID-19 still a significant issue and debt piling up to record levels, the Fed could be in a position where they feel the need to print enormously greater amounts of funds.
The distortions in asset markets are readily present as valuations of stocks have reached all-time highs (as outlined in last week’s Update). If it was not so serious, it would be humorous to think stock prices are near all-time highs at the same time earnings are plunging and the economy is displaying numbers of the type witnessed during depressions.
Rob Arnott of Research Affiliates recently stated, “People buying bubble assets will make money until they don’t. If they don’t have a view of what it will take for me to say, ‘OK, enough already, I’m going to get out,’ then they are doomed to ride the roller coaster over the top and down. So, without a sell discipline, buying bubble assets is insanely stupid.” (I’m glad Prudent Investment has a disciplined exit strategy.)
And it is not merely stocks showing incredible distortions, high yield bonds have yet to reflect the fact that the U.S. is experiencing a near record level of corporate bankruptcies. The “hope” is the Fed can keep asset prices propped-up indefinitely. Unfortunately, history proves that this is not possible. But it does not mean they will not give it their best try.
To understand the state of the economy, let’s examine some economic data. Last week, the Bureau of Economic Analysis (BEA) announced second quarter annualized real GDP growth was -32.9%. This is the largest quarterly drop on record. Notice how much worse second quarter was compared to the six previous recessions highlighted in gray below.
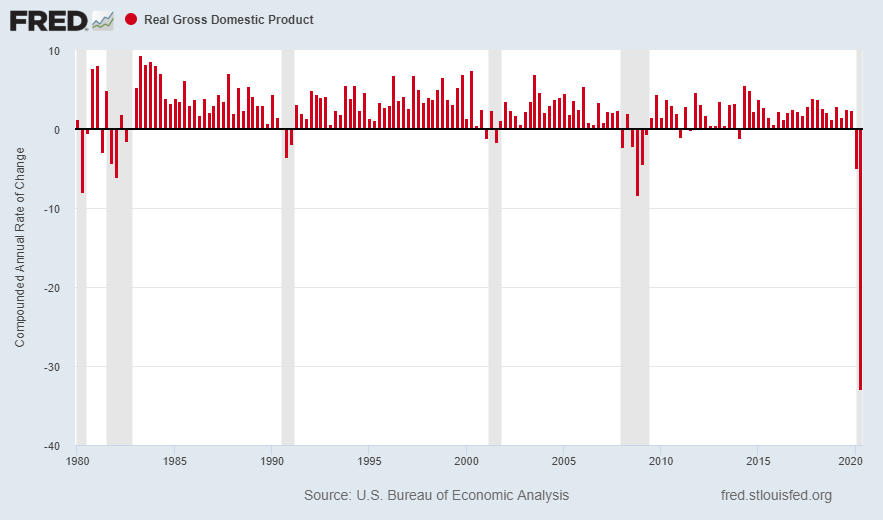
Pundits are already claiming the economy will bounce back, with talks of a jump of 17% in the third quarter. After such a deep drop in Q2, it would only be reasonable to expect some jump off of the bottom. However, remember, if the economy falls 33%, it must rise 50% just to get back where it was before the plunge. So, even if the economy rose 17% in Q3, it would still need to rise another 28% to get back to the pre-Q2 plunge.
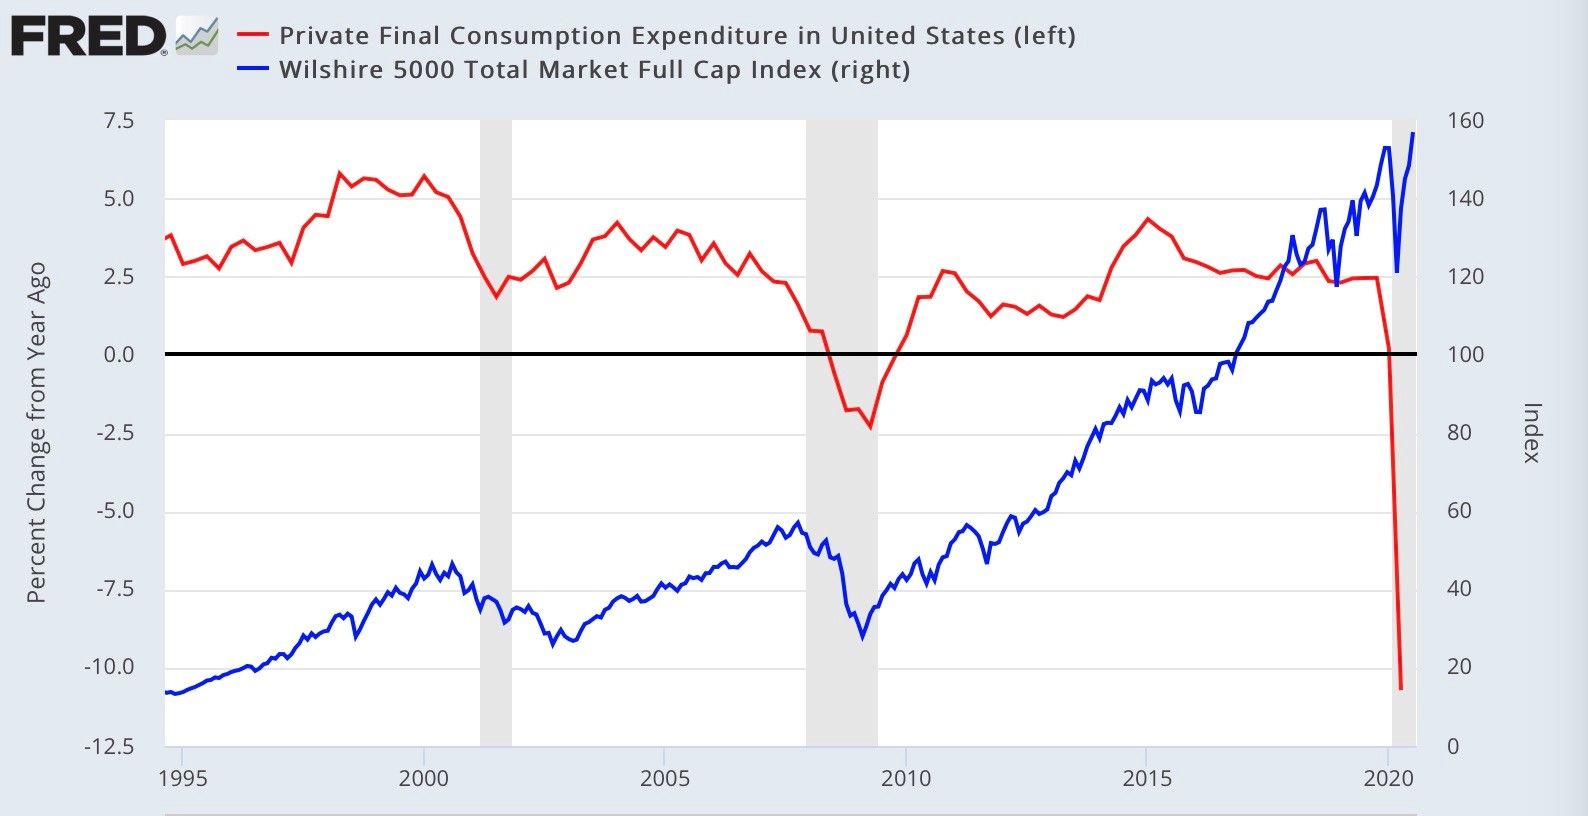
Is that possible? Anything is possible, but this would be highly unlikely given current economic activity and the present level of debt. Economic growth in the U.S. is predominantly a result of personal consumption. Look at the graph below and notice what has happened to consumption (in red).
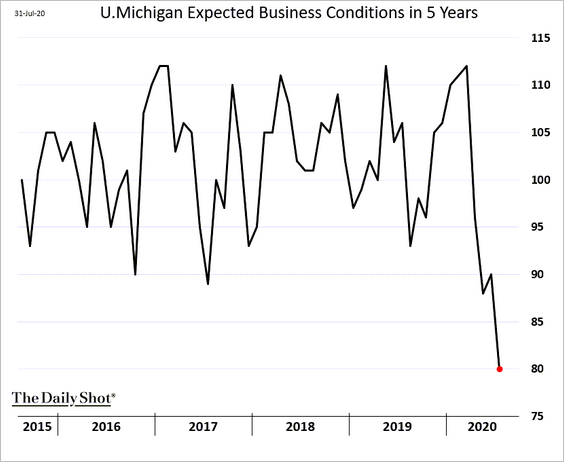
And with near record company bankruptcies, it should come as no surprise that business sentiment has soured. See below.
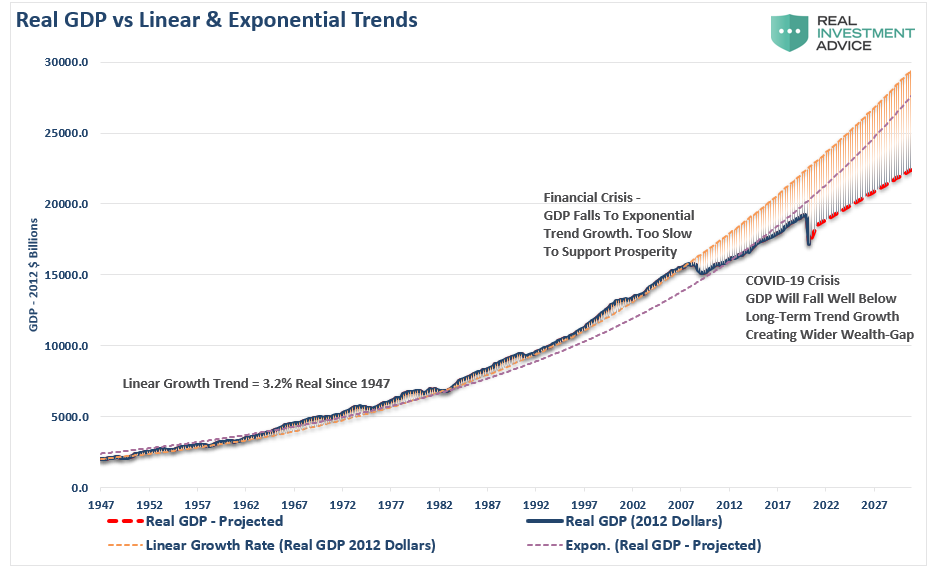
I have explained in prior missives how debt becomes a drag on GDP growth. The graph below from economist Lance Roberts shows the pre-Financial Crisis long-term trend in GDP growth was about 3.2%. After the Financial Crisis, the surge in debt slowed the growth trend to about 2.2%. As debt continues to compound, the current outlook for future GDP growth is down to around 1-1.5%. The greater the debt burden, the slower the economy can grow in the future.
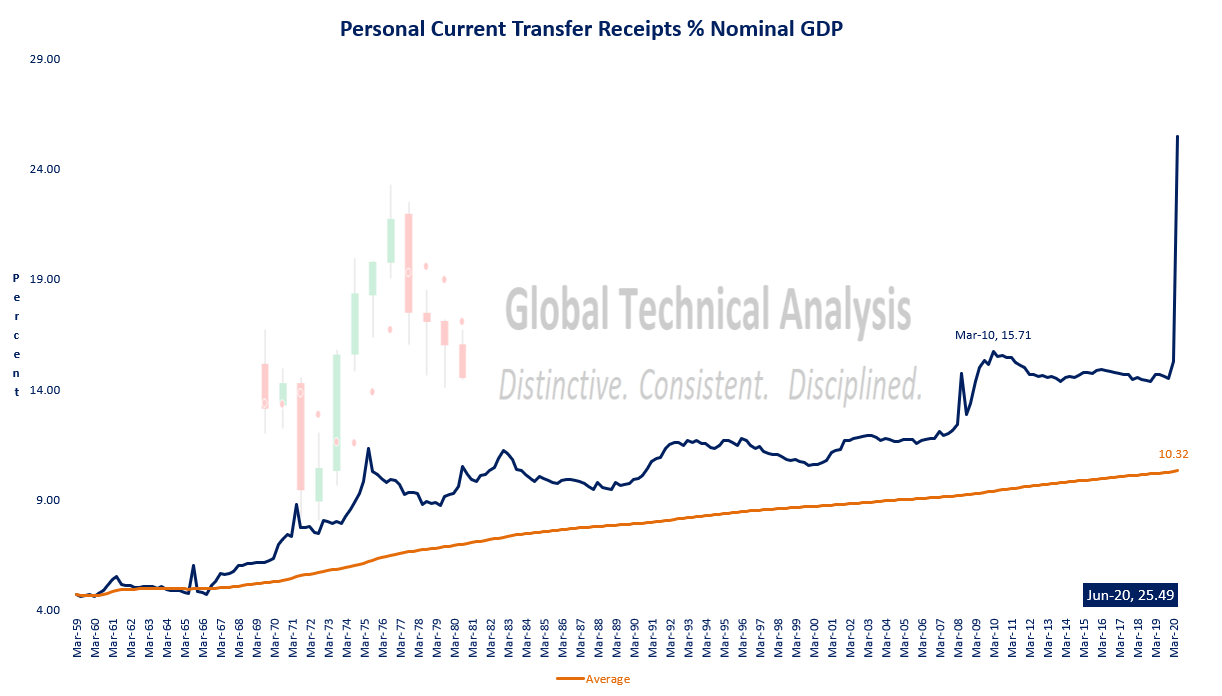
A couple weeks ago I wrote a newsletter entitled: “Why Does It Not ‘Feel’ Like a Recession?” The short answer is due to government stimulus assistance. Notice in the chart below the vertical line surge in personal transfer receipts as a percentage of GDP. Not only are equity and bond markets being distorted by the Fed and the Federal government, but all markets are impacted by the enormous level of government transfer payments.
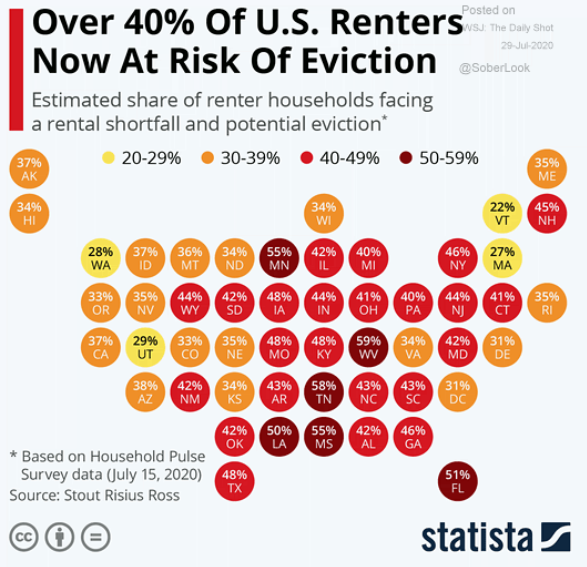
Yet, despite the massive money printing and increases in debt and stimulus programs, individuals are suffering and cannot pay their rent. Notice below, 40% of renters now face the possibility of eviction.
This is not supportive of a resurgence in economic growth. The Fed has indicated they will use all of their “tools” to help the economy recover. I do not believe we have seen the tip of the iceberg as to what is down the road. I am frequently asked: “what happens to the economy if this continues?” I have attempted and will continue to try to shed some light on the future possibilities. One thing is for sure, free markets have disappeared. The distortions resulting from the Fed and Federal government involvement will only escalate from here…until the final reset.
The S&P 500 Index closed at 3,271 up 1.7% for the week. The yield on the 10-year Treasury Note fell to 0.54%. Oil prices decreased to $40 per barrel, and the national average price of gasoline according to AAA remained at $2.18 per gallon.
© 2020. This material was prepared by Bob Cremerius, CPA/PFS, of Prudent Financial, and does not necessarily represent the views of other presenting parties, nor their affiliates. This information should not be construed as investment, tax or legal advice. Past performance is not indicative of future performance. An index is unmanaged and one cannot invest directly in an index. Actual results, performance or achievements may differ materially from those expressed or implied. All information is believed to be from reliable sources; however we make no representation as to its completeness or accuracy.
Securities offered through First Heartland Capital, Inc., Member FINRA & SIPC. | Advisory Services offered through First Heartland Consultants, Inc. Prudent Financial is not affiliated with First Heartland Capital, Inc.

