Executive Summary
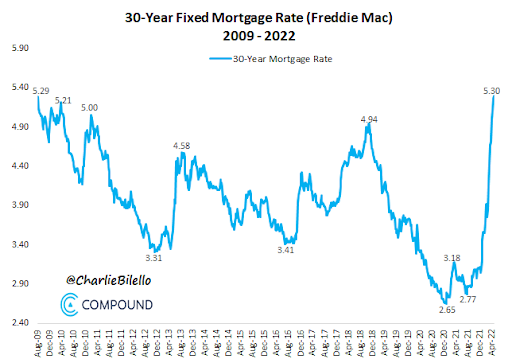
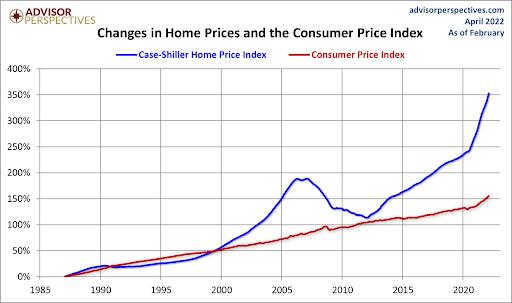
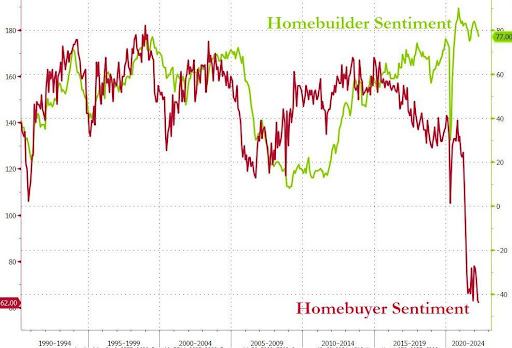
Most people have noticed home prices have exploded due to extremely low mortgage rates post COVID along with low inventory levels. Inflation and mortgage rates have risen sharply; however, government stimulus has ended. Wages have not kept pace which means housing is very unaffordable (see 2nd and 3rd graphs). For example, with mortgage rates increasing to 5.3%, a home costing $337,000 would have to sell for around $245,000 to keep the monthly note the same as when mortgage rates were at their bottom. The sixth graph is most telling of the housing bubble. As one can see when home prices deviate from the inflation rate as in 2008, then a correction ensues. And lastly, there is a disconnect between high homebuilder sentiment, and low homebuyer sentiment (last graph). They both cannot be correct! The storm is brewing for the housing market.
Please proceed to The Details.
“Look at market fluctuations as your friend rather than your enemy; profit from folly rather than participate in it.”
–Warren Buffett
The Details
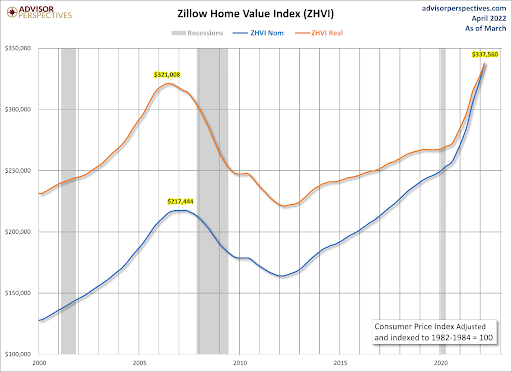
The convergence of consumers loaded with stimulus funds, mortgage rates dropping to a mere 2.65% at the end of 2020, and low housing inventory led to an explosion in housing prices. As seen in the graph below, both nominal and real (inflation-adjusted) Zillow “Typical Home Values” surpassed the peak of the previous housing bubble, which led to the Great Recession and financial crisis.
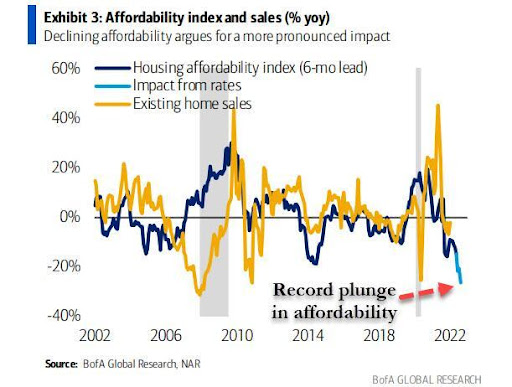
Just a brief time after mortgage rates bottomed and the Federal stimulus funds dried up, home inventory is growing, and interest rates are soaring. This perfect storm has led to a dramatic drop in housing affordability.
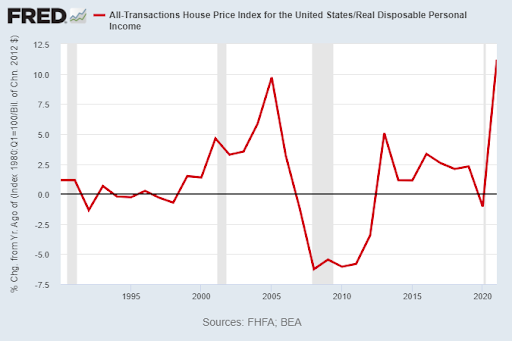
Additionally, the impact of inflation on disposable income has left home buyers with less savings to purchase new homes. The graph below shows the Home Price Index divided by Real Disposable Income. This measure of affordability shows homes are less affordable than during the peak of the last housing bubble.
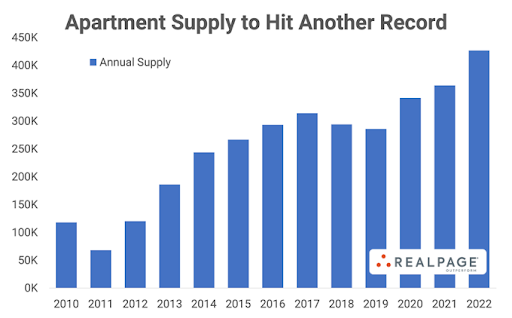
When the cost of homes rises at the same time real disposable income is declining, fewer people are able to upgrade their homes and inventory begins to grow. After reaching a low of 3.5 months supply at the end of 2020, the number of months supply has grown to 6.4. Also, there is a record wave of new apartments being built which will soon flood the market.
The most critical factor in deciding the size of home to be purchased is typically the mortgage interest rate. After bottoming at 2.65%, mortgage rates have skyrocketed to 5.3%. This means the monthly mortgage payment for a home priced at the current Zillow “Typical Home Value” as shown in the graph above (for a 30-year mortgage after 20% down payment, excluding taxes and insurance) has jumped from $1,088 to 1,500. This is a 38% increase in the monthly mortgage payment. If a new purchaser wanted to keep the mortgage payment at $1,088, he/she would have to purchase a home worth $244,910 instead of $337,560.
As I have written before, over the long-run, housing prices have typically tracked the level of inflation. If home prices grow faster than wage inflation, then homes become unaffordable. The graph below is one of my favorites. The two housing bubbles are clearly visible. At the top of bubbles, most people believe that times have changed, and a new paradigm has taken over. Eventually they realize, unfortunately too-late for many, the “old” benchmarks are still relevant.
Currently, either homebuilders or homebuyers are right, but not both. The graph below shows a tremendous gap between the optimism of homebuilders and the current fear of homebuyers. Being that a recession is either here or close by, I assume the gap will be filled as homebuilders suddenly realize that buyers are starting to withdraw as homes become more unaffordable.
Unfortunately, a perfect storm is brewing in the housing market as consumers are seeing income and savings decrease, raging inflation, house prices at bubble levels, interest rates soaring, buyer sentiment plunging, and the overall economy slowing with a recession likely to start this year. Anyone wanting to purchase a new house today should consider the above and the possibility of delaying their purchase until home prices return to reasonable levels, interest rates drop, and the economy appears to be strengthening not approaching recession.
The S&P 500 Index closed at 4,024, down 2.6% for the week. The yield on the 10-year Treasury
Note fell to 2.93%. Oil prices remained at $110 per barrel, and the national average price of gasoline according to AAA rose to $4.47 per gallon.
© 2022. This material was prepared by Bob Cremerius, CPA/PFS, of Prudent Financial, and does not necessarily represent the views of other presenting parties, nor their affiliates. This information should not be construed as investment, tax or legal advice. Past performance is not indicative of future performance. An index is unmanaged and one cannot invest directly in an index. Actual results, performance or achievements may differ materially from those expressed or implied. All information is believed to be from reliable sources; however we make no representation as to its completeness or accuracy.
Securities offered through First Heartland Capital, Inc., Member FINRA & SIPC. | Advisory Services offered through First Heartland Consultants, Inc. Prudent Financial is not affiliated with First Heartland Capital, Inc.
