Executive Summary
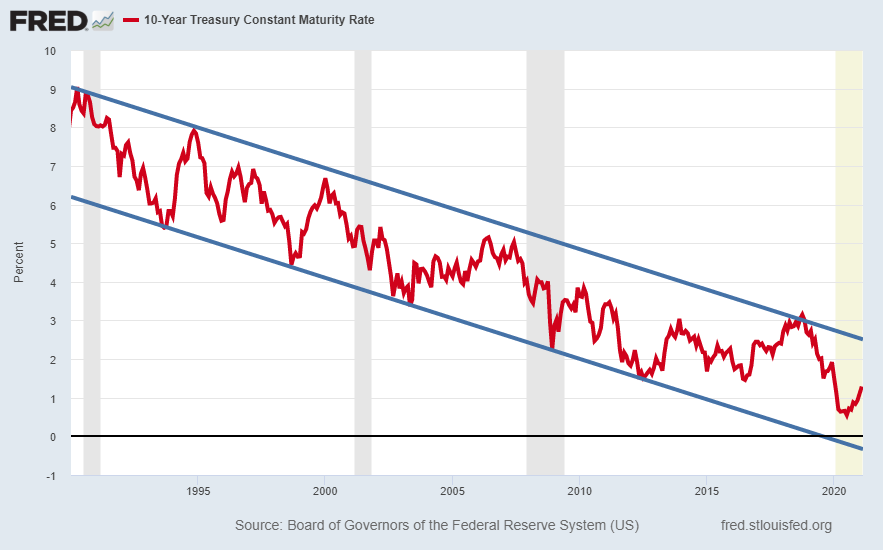
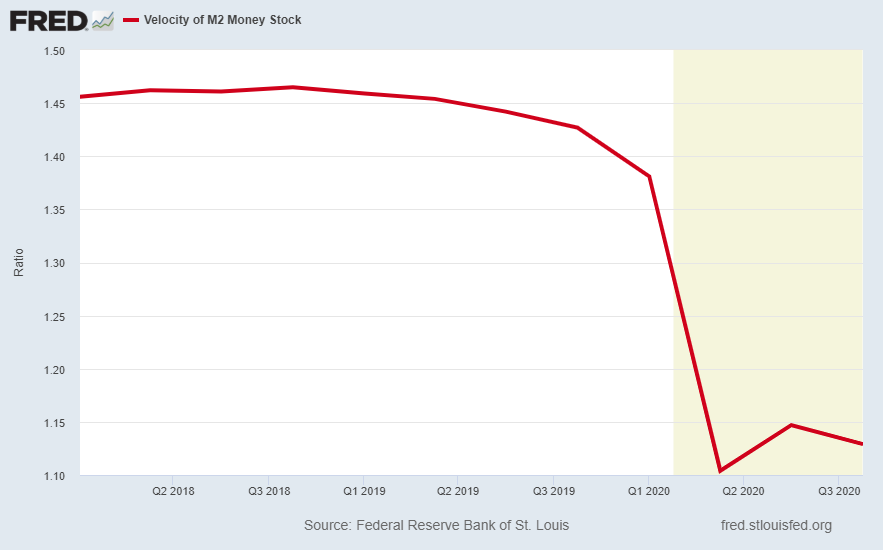
Many are looking at the recent surge in long-term Treasury yields as a sign that inflation is on the horizon. The yield has bounced back and forth in a channel for some time. Looking at the graph below, the recent bounce does not yet appear to be a cause of concern as it remains squarely in this channel. Despite the surge in M2 (Cash, checking and savings) and debt, velocity has recently fallen. The stimulus funds did provide a slight bump in velocity, but most funds found their way into savings as seen in the graph below. Much of this savings ended up in the speculative stock market. My expectation is the outrageous speculative bubble in stocks will burst leading to a significant correction in stock prices. This will lead to another slowdown in the economy which will lead to MMT. I believe the recent jump in Treasury yields is a little premature and will likely fall during the next down cycle. Inflation, in my opinion, is more likely after such MMT phase. In The Details below, I take a brief glance at the impact of inflation on the stock market in Germany during the hyperinflation of the Weimar Republic in the early 1920s.
Please proceed to The Details.
“Germany’s inflation cycle ran not for a year but for nine years, representing eight years of gestation and only one year of collapse.”
–Jens Parsson – Dying of Money: Lessons of the Great German and American Inflations
The Details
Many are looking at the recent surge in long-term Treasury yields as a sign that inflation is on the horizon. Even Dr. Michael Burry (of the movie “The Big Short”) was active on Twitter recently providing quotes regarding the prelude to and aftermath of Germany’s Weimar Republic from 1914 to 1923. An article was written on Zero Hedge summarizing Dr. Burry’s Tweets. In this article they quoted Dr. Burry as saying, “… ‘2010-2021: Gestation’ [a comparison to 1914-1923] adding that ‘when dollars might as well be falling from the sky…management teams get creative and ultimately take more risk… paying out debt-financed dividends to investors or investing in risky growth opportunities has beaten a frugal mentality hands down.’”
The graph below provides a visual of Germany’s stock market during the hyperinflationary period 1913-1928. Despite intermittent surges, the end result was a real loss of close to 90% over this 15-year period.

Is the U.S. on the cusp of an inflationary surge? Many “experts” believe so. My opinion is that it is likely to come after the next deflationary bust in the stock market and economy. The predictable reaction by the Fed and Federal Government will be to turn to MMT (Modern Monetary Theory) and drop trillions of dollars onto the public, all financed by debt purchased with created funds by the Fed. The magnitude of the MMT could provide the entry into hyperinflation. But again, I believe this comes after the next significant downturn in the markets and the economy.
Let us look at what has happened recently with the 10-year Treasury yield. It has jumped quite considerably from a low of close to 0.5% to last week’s close at 1.35%. However, notice in the graph below, the 10-year yield has been falling for decades (dating back to early 1980). Also, pay particular attention to the drop in yields during each recession on the chart (gray shaded areas plus the current recession in yellow).

Upon closer examination, the yield has bounced back and forth in a channel for some time. Looking at the graph below, the recent bounce does not yet appear to be a cause of concern as it remains squarely in this channel.

The concern about inflation is reasonable when one looks exclusively at the unprecedented growth in the M2 (cash, checking and savings deposits) shown below.

In order to create inflation, this money must circulate within the economy. And that is the fly in the ointment for those expecting inflation. The chart below displays the velocity of M2, or in plain English, how often those dollars turn over or circulate during a year. After a brief uptick resulting from the near $3 trillion stimulus package, it has turned back down to near all-time lows.

In order to produce inflation, it is necessary for velocity to rise. Some might be wondering, where all of the money (M2) went if it was not circulating through the economy. Some of the stimulus was spent, hence the slight bump in velocity during the second quarter of 2020. However, the vast majority of the funds were saved thus leading to a surge in the savings rate. The graph below illustrates that while total debt soared (red line) the savings rate also surged (blue line).

This jump in savings also contributed to the speculative mania being witnessed in the stock market. The opening of no-fee brokerage accounts has lured many new individuals who do not want to miss-out on “easy-money” (as discussed in my newsletter a couple weeks ago).
And while there are always pockets of inflation in certain sectors, the indices of core inflation as determined by the Bureau of Labor Statistics (BLS) are not yet indicating a surge in inflation. See the chart below.

My expectation is the outrageous speculative bubble in stocks will burst leading to a significant correction in stock prices. This will lead to another slowdown in the economy. As is always the case, businesses, banks and investors will look to the Federal Government and Fed to “save” the economy and stock market. As the equity market plunges, I believe long-term Treasury yields will drop as investors look for safe havens.
The response from the government, as explained above, will likely be an even larger money drop onto individuals and businesses. This can only be done by allowing the Fed to electronically purchase the debt necessary to fund the enormous bailouts. The potential size of the stimulus and rescue funds could lead to soaring inflation rates as velocity skyrockets. If this event is similar to what occurred in Germany’s Weimar Republic or to the Great Depression in the U.S., the stock market could look like Germany’s (graph above) or the Dow below.

I believe the recent jump in Treasury yields is a little premature and will likely fall during the next down cycle. However, monitoring Fed activity and the velocity of M2 is important to see the early warning signs.
The S&P 500 Index closed at 3,907, down 0.7% for the week. The yield on the 10-year Treasury Note rose to 1.35%. Oil prices decreased to $59 per barrel, and the national average price of gasoline according to AAA rose to $2.63 per gallon.
© 2020. This material was prepared by Bob Cremerius, CPA/PFS, of Prudent Financial, and does not necessarily represent the views of other presenting parties, nor their affiliates. This information should not be construed as investment, tax or legal advice. Past performance is not indicative of future performance. An index is unmanaged and one cannot invest directly in an index. Actual results, performance or achievements may differ materially from those expressed or implied. All information is believed to be from reliable sources; however we make no representation as to its completeness or accuracy.
Securities offered through First Heartland Capital, Inc., Member FINRA & SIPC. | Advisory Services offered through First Heartland Consultants, Inc. Prudent Financial is not affiliated with First Heartland Capital, Inc.

